Predicting tropical dry forest successional attributes from space: is the key hidden in image texture?
- PMID: 22363443
- PMCID: PMC3282724
- DOI: 10.1371/journal.pone.0030506
Predicting tropical dry forest successional attributes from space: is the key hidden in image texture?
Abstract
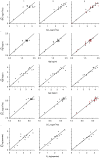
Biodiversity conservation and ecosystem-service provision will increasingly depend on the existence of secondary vegetation. Our success in achieving these goals will be determined by our ability to accurately estimate the structure and diversity of such communities at broad geographic scales. We examined whether the texture (the spatial variation of the image elements) of very high-resolution satellite imagery can be used for this purpose. In 14 fallows of different ages and one mature forest stand in a seasonally dry tropical forest landscape, we estimated basal area, canopy cover, stem density, species richness, Shannon index, Simpson index, and canopy height. The first six attributes were also estimated for a subset comprising the tallest plants. We calculated 40 texture variables based on the red and the near infrared bands, and EVI and NDVI, and selected the best-fit linear models describing each vegetation attribute based on them. Basal area (R(2) = 0.93), vegetation height and cover (0.89), species richness (0.87), and stand age (0.85) were the best-described attributes by two-variable models. Cross validation showed that these models had a high predictive power, and most estimated vegetation attributes were highly accurate. The success of this simple method (a single image was used and the models were linear and included very few variables) rests on the principle that image texture reflects the internal heterogeneity of successional vegetation at the proper scale. The vegetation attributes best predicted by texture are relevant in the face of two of the gravest threats to biosphere integrity: climate change and biodiversity loss. By providing reliable basal area and fallow-age estimates, image-texture analysis allows for the assessment of carbon sequestration and diversity loss rates. New and exciting research avenues open by simplifying the analysis of the extent and complexity of successional vegetation through the spatial variation of its spectral information.
Conflict of interest statement
Figures


Similar articles
-
Habitat heterogeneity captured by 30-m resolution satellite image texture predicts bird richness across the United States.Ecol Appl. 2020 Dec;30(8):e02157. doi: 10.1002/eap.2157. Epub 2020 Jun 1. Ecol Appl. 2020. PMID: 32358975
-
[Effects of landscape and vegetation structure on the diversity of phyllostomid bats (Chiroptera: Phyllostomidae) in Oaxaca, Mexico].Rev Biol Trop. 2014 Mar;62(1):217-39. Rev Biol Trop. 2014. PMID: 24912355 Spanish.
-
Multiple successional pathways in human-modified tropical landscapes: new insights from forest succession, forest fragmentation and landscape ecology research.Biol Rev Camb Philos Soc. 2017 Feb;92(1):326-340. doi: 10.1111/brv.12231. Epub 2015 Nov 5. Biol Rev Camb Philos Soc. 2017. PMID: 26537849
-
[Effect of management on tree diversity in secondary vegetation in the Biosphere Reserve of Calakmul, Campeche, Mexico].Rev Biol Trop. 2017 Mar;65(1):41-53. Rev Biol Trop. 2017. PMID: 29465957 Spanish.
-
Ecological integrity of tropical secondary forests: concepts and indicators.Biol Rev Camb Philos Soc. 2023 Apr;98(2):662-676. doi: 10.1111/brv.12924. Epub 2022 Dec 1. Biol Rev Camb Philos Soc. 2023. PMID: 36453621 Review.
Cited by
-
Global tropical dry forest extent and cover: A comparative study of bioclimatic definitions using two climatic data sets.PLoS One. 2021 May 20;16(5):e0252063. doi: 10.1371/journal.pone.0252063. eCollection 2021. PLoS One. 2021. PMID: 34015004 Free PMC article.
-
Determining the K coefficient to leaf area index estimations in a tropical dry forest.Int J Biometeorol. 2018 Jul;62(7):1187-1197. doi: 10.1007/s00484-018-1522-6. Epub 2018 Mar 15. Int J Biometeorol. 2018. PMID: 29546488
-
Prediction of Biomass and N Fixation of Legume-Grass Mixtures Using Sensor Fusion.Front Plant Sci. 2021 Jan 21;11:603921. doi: 10.3389/fpls.2020.603921. eCollection 2020. Front Plant Sci. 2021. PMID: 33597959 Free PMC article.
-
Remote sensing of savanna woody species diversity: A systematic review of data types and assessment methods.PLoS One. 2022 Dec 1;17(12):e0278529. doi: 10.1371/journal.pone.0278529. eCollection 2022. PLoS One. 2022. PMID: 36455048 Free PMC article.
-
The Effects of GLCM parameters on LAI estimation using texture values from Quickbird Satellite Imagery.Sci Rep. 2017 Aug 4;7(1):7366. doi: 10.1038/s41598-017-07951-w. Sci Rep. 2017. PMID: 28779107 Free PMC article.
References
-
- Hassan R, Scholes R, Ash N. Ecosystems and Human Well-being: current state and trends. Washington, D.C.: Island Press; 2005. 922
-
- Janzen D. Gardenification of wildland nature and the human footprint. Science. 1998;279:1312–1313.
-
- Lepers E, Lambin E, Janetos A, DeFries R, Achard F, et al. A synthesis of information on rapid land cover change for the period 1981–2000. Bioscience. 2005;55:115–124.
-
- Sanderson EW, Jaiteh M, Levy MA, Redford KH, Wannebo AV, et al. The human footprint and the last of the wild. Bioscience. 2002;52:891–904.
-
- Fearnside P, Laurance W. Tropical deforestation and greenhouse-gas emissions. Ecol Appl. 2004;14:982–986.
Publication types
MeSH terms
LinkOut - more resources
Full Text Sources

