Comparative Study
. 2012;7(2):e30751.
doi: 10.1371/journal.pone.0030751. Epub 2012 Feb 17.

A comparative study of human TLR 7/8 stimulatory trimer compositions in influenza A viral genomes

Affiliations
Comparative Study

A comparative study of human TLR 7/8 stimulatory trimer compositions in influenza A viral genomes

Chu-Wen Yang et al. PLoS One. 2012.

Abstract

Background: Variation in the genomes of single-stranded RNA viruses affects their infectivity and pathogenicity in two ways. First, viral genome sequence variations lead to changes in viral protein sequences and activities. Second, viral genome sequence variation produces diversity at the level of nucleotide composition and diversity in the interactions between viral RNAs and host toll-like receptors (TLRs). A viral genome-typing method based on this type of diversity has not yet been established.

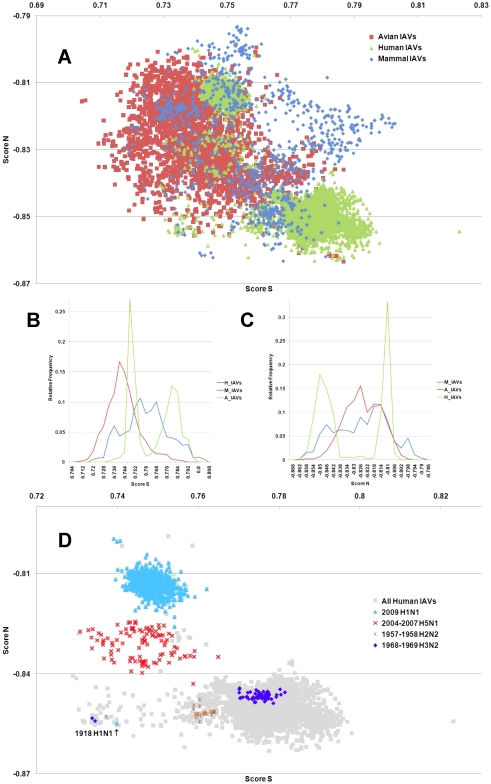
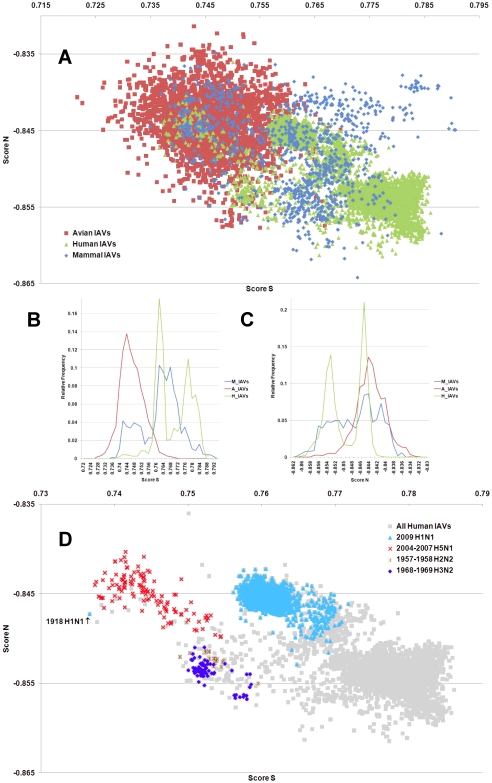
Methodology/principal findings: In this study, we propose a novel genomic trait called the "TLR stimulatory trimer composition" (TSTC) and two quantitative indicators, Score S and Score N, named "TLR stimulatory scores" (TSS). Using the complete genome sequences of 10,994 influenza A viruses (IAV) and 251 influenza B viruses, we show that TSTC analysis reveals the diversity of Score S and Score N among the IAVs isolated from various hosts. In addition, we show that low values of Score S are correlated with high pathogenicity and pandemic potential in IAVs. Finally, we use Score S and Score N to construct a logistic regression model to recognize IAV strains that are highly pathogenic or have high pandemic potential.

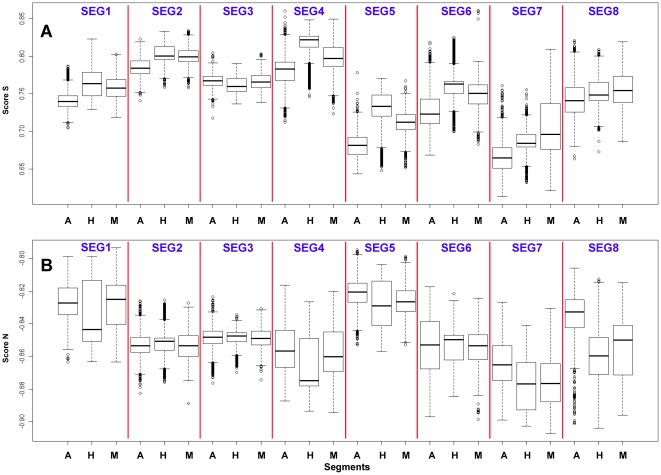
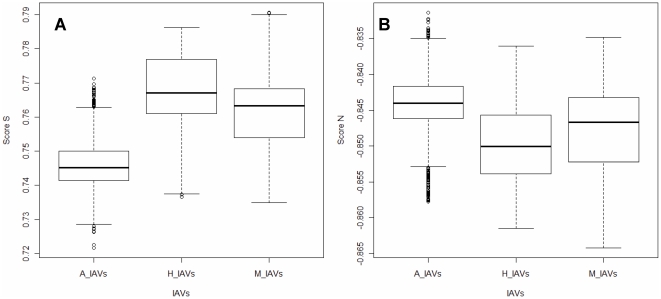
Conclusions/significance: Results from the TSTC analysis indicate that there are large differences between human and avian IAV genomes (except for segment 3), as illustrated by Score S. Moreover, segments 1, 2, 3 and 4 may be major determinants of the stimulatory activity exerted on human TLRs 7 and 8. We also find that a low Score S value is associated with high pathogenicity and pandemic potential in IAV. The π value from the TSS-derived logistic regression model is useful for recognizing emerging IAVs that have high pathogenicity and pandemic potential.


Conflict of interest statement

Competing Interests: The authors have declared that no competing interests exist.

Figures

Figure 1
Figure 1. The hTLR stimulatory score distributions for segment 1.
10,994 IAVs, including 3,324 avian (red), 6,658 human (green) and 1,012 mammalian (blue) IAVs were used in this analysis. (A) The distribution of the hTLR stimulatory scores of segment 1 genomic RNAs. The x-axis represents Score S, the y-axis represents Score N. (B) The relative frequency distribution of Score S from segment 1 genomic RNAs. The x-axis indicates Score S, the y-axis gives the relative frequency. (C) The relative frequency distribution of Score N from segment 1 genomic RNAs. The x-axis represents Score N, the y-axis represents the relative frequency. (D) The distribution of the hTLR stimulatory scores of segment 1 genomic RNAs from 6,658 human IAVs (gray). The highly pathogenic/pandemic-associated IAVs are highlighted. The x-axis represents Score S, and the y-axis represents Score N.
Figure 2
Figure 2. The hTLR stimulatory score distributions for segment 2.
10,994 IAVs, including 3,324 avian (red), 6,658 human (green) and 1,012 mammalian (blue) IAVs were used in this analysis. (A) The distributions of the hTLR stimulatory scores of segment 2 genomic RNAs. The x-axis represents Score S, the y-axis represents Score N. (B) The relative frequency distribution of Score S from segment 2 genomic RNAs. The x-axis indicates Score S, the y-axis gives the relative frequency. (C) The relative frequency distribution of Score N from segment 2 genomic RNAs. The x-axis represents Score N, the y-axis represents the relative frequency. (D) The distribution of the hTLR stimulatory scores of segment 2 genomic RNAs from 6,658 human IAVs (gray). The pandemic-associated IAVs are highlighted. The x-axis represents Score S, and the y-axis represents Score N.
Figure 3
Figure 3. The hTLR stimulatory score distributions for segment 3.
10,994 IAVs, including 3,324 avian (red), 6,658 human (green) and 1,012 mammalian (blue) IAVs were used in this analysis. (A) The distributions of the hTLR stimulatory scores of segment 3 genomic RNAs. The x-axis represents Score S, the y-axis represents Score N. (B) The relative frequency distribution of Score S from segment 3 genomic RNAs. The x-axis indicates Score S, the y-axis gives the relative frequency. (C) The relative frequency distribution of Score N from segment 3 genomic RNAs. The x-axis represents Score N, the y-axis represents the relative frequency. (D) The distribution of the hTLR stimulatory scores of segment 3 genomic RNAs from 6,658 human IAVs (gray). The pandemic-associated IAVs are highlighted. The x-axis represents Score S, and the y-axis represents Score N.
Figure 4
Figure 4. The hTLR stimulatory score distributions for segment 4.
10,994 IAVs, including 3,324 avian (red), 6,658 human (green) and 1,012 mammalian (blue) IAVs were used in this analysis. (A) The distributions of the hTLR stimulatory scores of segment 4 genomic RNAs. The x-axis represents Score S, the y-axis represents Score N. (B) The relative frequency distribution of Score S from segment 4 genomic RNAs. The x-axis indicates Score S, the y-axis gives the relative frequency. (C) The relative frequency distribution of Score N from segment 4 genomic RNAs. The x-axis represents Score N, the y-axis represents the relative frequency. (D) The distribution of the hTLR stimulatory scores of segment 4 genomic RNAs from 6,658 human IAVs (gray). The pandemic-associated IAVs are highlighted. The x-axis represents Score S, and the y-axis represents Score N.
Figure 5
Figure 5. The hTLR stimulatory score distributions for segment 5.
10,994 IAVs, including 3,324 avian (red), 6,658 human (green) and 1,012 mammalian (blue) IAVs were used in this analysis. (A) The distributions of the hTLR stimulatory scores of segment 5 genomic RNAs. The x-axis represents Score S, the y-axis represents Score N. (B) The relative frequency distribution of Score S from segment 5 genomic RNAs. The x-axis indicates Score S, the y-axis gives the relative frequency. (C) The relative frequency distribution of Score N from segment 5 genomic RNAs. The x-axis represents Score N, the y-axis represents the relative frequency. (D) The distribution of the hTLR stimulatory scores of segment 5 genomic RNAs from 6,658 human IAVs (gray). The pandemic-associated IAVs are highlighted. The x-axis represents Score S, and the y-axis represents Score N.
Figure 6
Figure 6. The hTLR stimulatory score distributions for segment 6.
10,994 IAVs, including 3,324 avian (red), 6,658 human (green) and 1,012 mammalian (blue) IAVs were used in this analysis. (A) The distributions of the hTLR stimulatory scores of segment 6 genomic RNAs. The x-axis represents Score S, the y-axis represents Score N. (B) The relative frequency distribution of Score S from segment 6 genomic RNAs. The x-axis indicates Score S, the y-axis gives the relative frequency. (C) The relative frequency distribution of Score N from segment 6 genomic RNAs. The x-axis represents Score N, the y-axis represents the relative frequency. (D) The distribution of the hTLR stimulatory scores of segment 6 genomic RNAs from 6,658 human IAVs (gray). The pandemic-associated IAVs are highlighted. The x-axis represents Score S, and the y-axis represents Score N.
Figure 7
Figure 7. The hTLR stimulatory score distributions for segment 7.
10,994 IAVs, including 3,324 avian (red), 6,658 human (green) and 1,012 mammalian (blue) IAVs were used in this analysis. (A) The distributions of the hTLR stimulatory scores of segment 7 genomic RNAs. The x-axis represents Score S, the y-axis represents Score N. (B) The relative frequency distribution of Score S from segment 7 genomic RNAs. The x-axis indicates Score S, the y-axis gives the relative frequency. (C) The relative frequency distribution of Score N from segment 7 genomic RNAs. The x-axis represents Score N, the y-axis represents the relative frequency. (D) The distribution of the hTLR stimulatory scores of segment 7 genomic RNAs from 6,658 human IAVs (gray). The pandemic-associated IAVs are highlighted. The x-axis represents Score S, and the y-axis represents Score N.
Figure 8
Figure 8. The hTLR stimulatory score distributions for segment 8.
10,994 IAVs, including 3,324 avian (red), 6,658 human (green) and 1,012 mammalian (blue) IAVs were used in this analysis. (A) The distributions of the hTLR stimulatory scores of segment 8 genomic RNAs. The x-axis represents Score S, the y-axis represents Score N. (B) The relative frequency distribution of Score S from segment 8 genomic RNAs. The x-axis indicates Score S, the y-axis gives the relative frequency. (C) The relative frequency distribution of Score N from segment 8 genomic RNAs. The x-axis represents Score N, the y-axis represents the relative frequency. (D) The distribution of the hTLR stimulatory scores of segment 8 genomic RNAs from 6,658 human IAVs (gray). The pandemic-associated IAVs are highlighted. The x-axis represents Score S, and the y-axis represents Score N.
Figure 9
Figure 9. The hTLR stimulatory score distributions of the whole genome (all eight segments combined).
10,994 IAVs, including 3,324 avian (red), 6,658 human (green) and 1,012 mammalian (blue) IAVs were used in this analysis. (A) The distributions of the hTLR stimulatory scores from eight genomic RNAs. The x-axis represents Score S; the y-axis represents Score N. (B) The relative frequency distributions of Score S from eight genomic RNAs. The x-axis represents Score S; the y-axis represents the relative frequency. (C) The relative frequency distributions of Score N from eight genomic RNAs. The x-axis represents Score N; the y-axis represents the relative frequency. (D) The distribution of the hTLR stimulatory scores from eight genomic RNAs from 6658 human IAVs (gray). The pandemic-associated IAVs are highlighted. The x-axis represents Score S, and the y-axis represents Score N.
Figure 10
Figure 10. The hTLR stimulatory score distribution of eight segments of IAVs from different hosts.
10,994 IAVs, including 3,324 avian [A], 6,658 human [H] and 1,012 mammalian [M] IAVs were used in this analysis. (A) The distribution of Score S for eight genomic RNAs. The x-axis shows the different host species, and the y-axis represents Score S. (B) The distribution of Score N for eight genomic RNAs. The x-axis represents the hosts, and the y-axis represents Score N.
Figure 11
Figure 11. The hTLR stimulatory score distribution of IAVs from different hosts.
A total of 10,994 IAV genomes, including 3,324 avian, 6,658 human and 1,012 mammalian IAVs were used in this analysis. For each IAV, eight segments were combined to compute the TLR stimulatory scores: (A) Score S and (B) Score N. The x-axis is the IAVs from different hosts (A_IAVs from avian, H_IAVs from human and M_IAVs from mammal); the y-axis is the TLR stimulatory score (Score S for left, Score N for right).
Figure 12
Figure 12. The hTLR stimulatory score distributions of the three types of influenza viruses.
The values of the TLR stimulatory score, Score S and Score N, of the human influenza A (6,658 genomes), B (251 genomes) and C (1 genome) viral genomes are illustrated.
Figure 13
Figure 13. Yearly dynamics of the human H3N2 IAVs displayed by the π value from the logistic regression model.
A box plot is used to illustrate the yearly dynamics of 2,096 human H3N2 IAVs from the IAV database. The x-axis gives the years in which the IAV data were recorded, while the y-axis indicates the π values of the IAVs, as computed by the logistic regression model. The red line indicates π = 0.95.
Figure 14
Figure 14. Yearly dynamics of the human H1N1 IAVs displayed by the π value from the logistic regression model.
A box plot is used to illustrate the yearly dynamics of 3,764 human H1N1 IAVs from the IAV database. The x-axis indicates the year in the record of the IAV data, and the y-axis indicates the π values of the IAVs as computed by the logistic regression model. The red line indicates π = 0.95.
Figure 15
Figure 15. Monthly dynamics of the human H1N1 IAVs (2009–2010) displayed by the π value from the logistic regression model.
A box plot is used to illustrate the monthly dynamics of 2,851 2009–2011 H1N1 IAVs from the IAV database. The x-axis indicates the month of each IAV data record, and the y-axis gives the π values of the IAVs as computed by the logistic regression model. The red line indicates π = 0.95.
Figure 16
Figure 16. Method design for scoring the interactions between viral RNAs and host (human) toll-like receptors 7/8 by analyzing the TLR 7/8 stimulatory trimer composition of viral RNAs.

Similar articles

Cited by

References

    1. Nelson MI, Holmes EC. The evolution of epidemic influenza. Nat Rev Genet. 2007;8:196–205. - PubMed
    1. Rambaut A, Pybus OG, Nelson MI, Viboud C, Taubenberger JK, et al. The genomic and epidemiological dynamics of human influenza A virus. Nature. 2008;453:615–619. - PMC - PubMed
    1. Tscherne DM, García-Sastre A. Virulence determinants of pandemic influenza viruses. J Clin Invest. 2011;121:6–13. - PMC - PubMed
    1. Chen GW, Shih SR. Genomic signatures of influenza A pandemic (H1N1) 2009 virus. Emerg Infect Dis. 2009;15:1897–1903. - PMC - PubMed
    1. Diebold SS. Recognition of viral single-stranded RNA by Toll-like receptors. Adv Drug Deliv Rev. 2008;60:813–823. - PubMed

Publication types