

Characterization of spontaneous bone marrow recovery after sublethal total body irradiation: importance of the osteoblastic/adipocytic balance
- PMID: 22363493
- PMCID: PMC3281884
- DOI: 10.1371/journal.pone.0030818
Characterization of spontaneous bone marrow recovery after sublethal total body irradiation: importance of the osteoblastic/adipocytic balance
Abstract
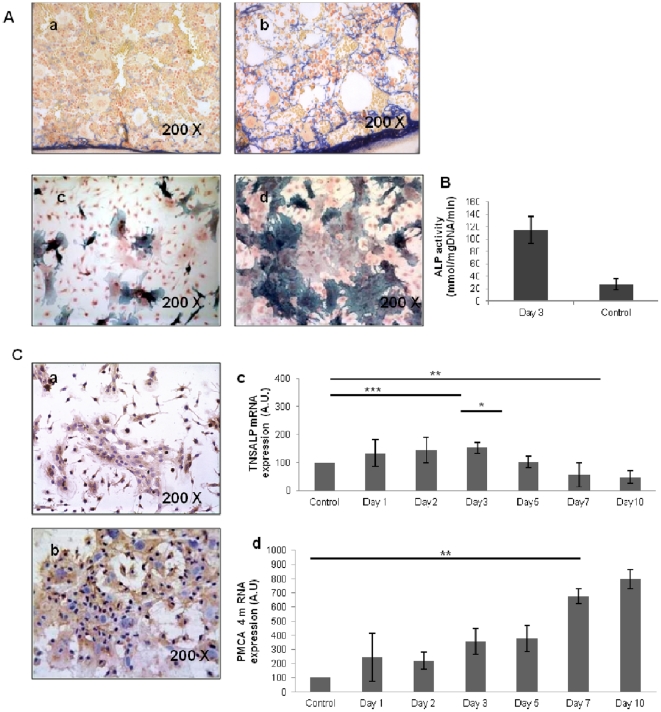
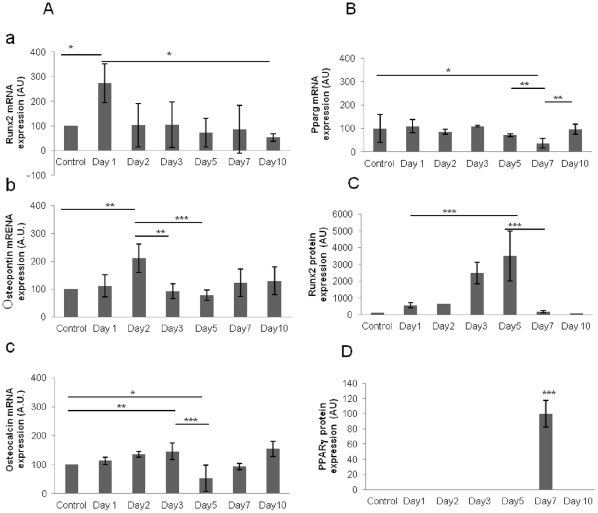
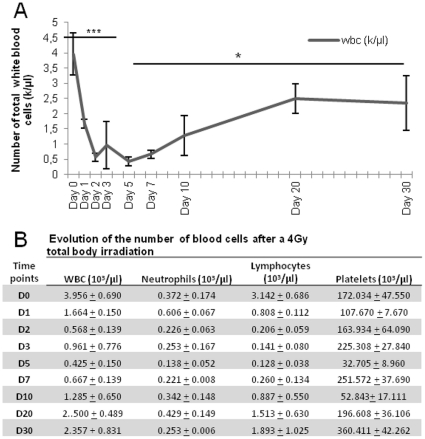
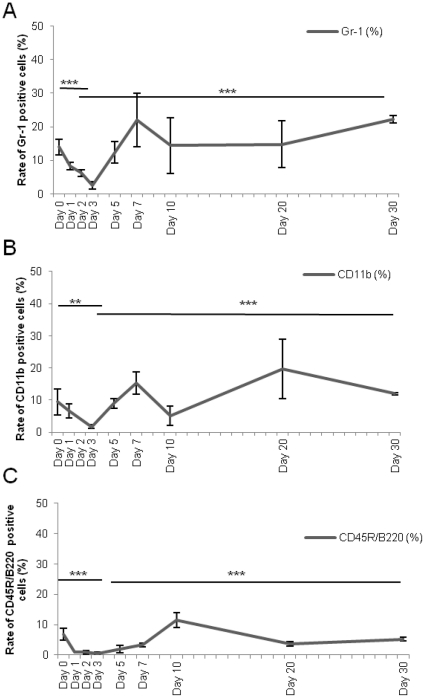
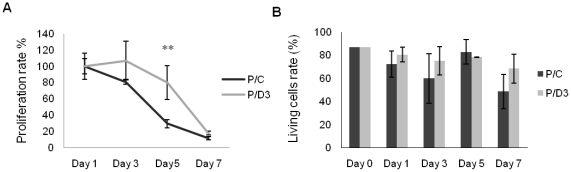
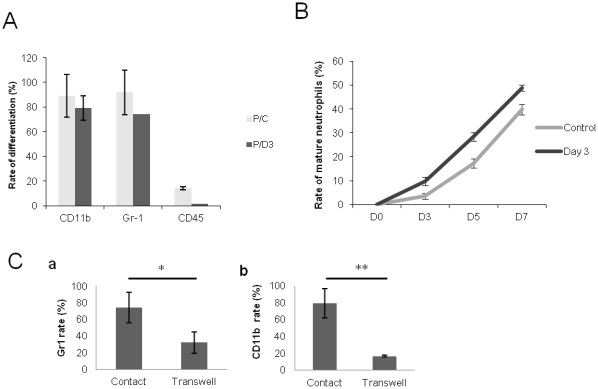
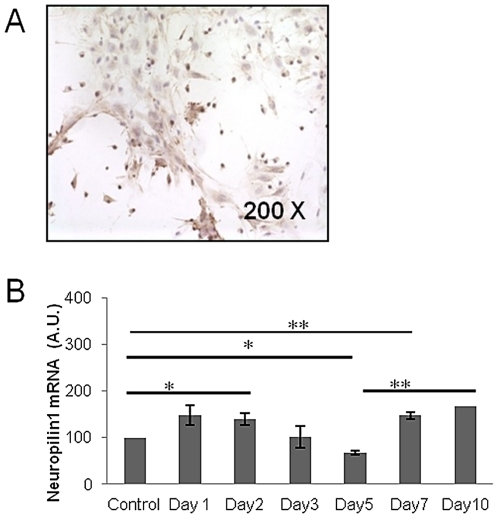
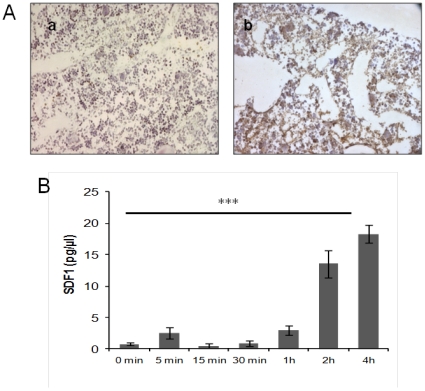
Many studies have already examined the hematopoietic recovery after irradiation but paid with very little attention to the bone marrow microenvironment. Nonetheless previous studies in a murine model of reversible radio-induced bone marrow aplasia have shown a significant increase in alkaline phosphatase activity (ALP) prior to hematopoietic regeneration. This increase in ALP activity was not due to cell proliferation but could be attributed to modifications of the properties of mesenchymal stem cells (MSC). We thus undertook a study to assess the kinetics of the evolution of MSC correlated to their hematopoietic supportive capacities in mice treated with sub lethal total body irradiation. In our study, colony-forming units-fibroblasts (CFU-Fs) assay showed a significant MSC rate increase in irradiated bone marrows. CFU-Fs colonies still possessed differentiation capacities of MSC but colonies from mice sacrificed 3 days after irradiation displayed high rates of ALP activity and a transient increase in osteoblastic markers expression while pparγ and neuropilin-1 decreased. Hematopoietic supportive capacities of CFU-Fs were also modified: as compared to controls, irradiated CFU-Fs significantly increased the proliferation rate of hematopoietic precursors and accelerated the differentiation toward the granulocytic lineage. Our data provide the first evidence of the key role exerted by the balance between osteoblasts and adipocytes in spontaneous bone marrow regeneration. First, (pre)osteoblast differentiation from MSC stimulated hematopoietic precursor's proliferation and granulopoietic regeneration. Then, in a second time (pre)osteoblasts progressively disappeared in favour of adipocytic cells which down regulated the proliferation and granulocytic differentiation and then contributed to a return to pre-irradiation conditions.
Conflict of interest statement
Figures

Similar articles
-
The effects of various irradiation doses on the growth and differentiation of marrow-derived human mesenchymal stromal cells.Pediatr Transplant. 2007 Jun;11(4):379-87. doi: 10.1111/j.1399-3046.2006.00663.x. Pediatr Transplant. 2007. PMID: 17493217
-
Soluble factor cross-talk between human bone marrow-derived hematopoietic and mesenchymal cells enhances in vitro CFU-F and CFU-O growth and reveals heterogeneity in the mesenchymal progenitor cell compartment.Blood. 2005 Nov 1;106(9):3012-9. doi: 10.1182/blood-2005-01-0433. Epub 2005 Jul 19. Blood. 2005. PMID: 16030193
-
Substance P stimulates the recovery of bone marrow after the irradiation.J Cell Physiol. 2011 May;226(5):1204-13. doi: 10.1002/jcp.22447. J Cell Physiol. 2011. PMID: 20945355
-
Osteoblastic cells: differentiation and trans-differentiation.Arch Biochem Biophys. 2008 May 15;473(2):183-7. doi: 10.1016/j.abb.2008.03.028. Epub 2008 Mar 29. Arch Biochem Biophys. 2008. PMID: 18406334 Review.
-
Mesenchymal progenitors and the osteoblast lineage in bone marrow hematopoietic niches.Curr Osteoporos Rep. 2014 Mar;12(1):22-32. doi: 10.1007/s11914-014-0190-7. Curr Osteoporos Rep. 2014. PMID: 24477415 Free PMC article. Review.
Cited by
-
Transient expansion and myofibroblast conversion of adipogenic lineage precursors mediate bone marrow repair after radiation.JCI Insight. 2022 Apr 8;7(7):e150323. doi: 10.1172/jci.insight.150323. JCI Insight. 2022. PMID: 35393948 Free PMC article.
-
The changing balance between osteoblastogenesis and adipogenesis in aging and its impact on hematopoiesis.Curr Osteoporos Rep. 2013 Jun;11(2):99-106. doi: 10.1007/s11914-013-0135-6. Curr Osteoporos Rep. 2013. PMID: 23423562 Free PMC article. Review.
-
Expression of interferon regulatory factors (IRF-1 and IRF-2) during radiation-induced damage and regeneration of bone marrow by transplantation in mouse.Mol Biol Rep. 2019 Feb;46(1):551-567. doi: 10.1007/s11033-018-4508-x. Epub 2018 Nov 28. Mol Biol Rep. 2019. PMID: 30488374
-
Marrow damage and hematopoietic recovery following allogeneic bone marrow transplantation for acute leukemias: Effect of radiation dose and conditioning regimen.Radiother Oncol. 2016 Jan;118(1):65-71. doi: 10.1016/j.radonc.2015.11.012. Epub 2015 Nov 30. Radiother Oncol. 2016. PMID: 26653357 Free PMC article.
-
Direct bone marrow HSC transplantation enhances local engraftment at the expense of systemic engraftment in NSG mice.Sci Rep. 2016 Apr 11;6:23886. doi: 10.1038/srep23886. Sci Rep. 2016. PMID: 27065210 Free PMC article.
References
-
- Arai F, Hirao A, Ohmura M, Sato H, Matsukoda S, Takubo K, et al. Tie2/Angiopoietin-1 Signaling Regulates Hematopoietic Stem Cell Quiescence in the Bone Marrow Niche. Cell. 2004;118:149–161. - PubMed
-
- Calvi LM, Adams GB, Weibrecht KW, Weber JM, Olson DP, et al. Osteoblastic cells regulate the haematopoietic stem cell niche. Nature. 2003:841–846. - PubMed
-
- Nilsson SK, Johnston HM, Coverdale JA. Spatial localization of transplanted hemopoietic stem cells: inferences for the localization of stem cell niches. Blood. 2001;97(8):2293–2299. - PubMed
-
- Zhang C. Granulocyte-colony stimulating factor-mobilized mesenchymal stem cells: a new resource for rapid engrafment in hematopoietic stem cell transplantation. Med Hypotheses. 2010;76(2):241–243. - PubMed
Publication types
MeSH terms
Substances
LinkOut - more resources
Full Text Sources
Other Literature Sources
