. 2012;7(2):e30947.
doi: 10.1371/journal.pone.0030947. Epub 2012 Feb 17.

Rice phospholipase A superfamily: organization, phylogenetic and expression analysis during abiotic stresses and development

Affiliations

Rice phospholipase A superfamily: organization, phylogenetic and expression analysis during abiotic stresses and development

Amarjeet Singh et al. PLoS One. 2012.

Abstract

Background: Phospholipase A (PLA) is an important group of enzymes responsible for phospholipid hydrolysis in lipid signaling. PLAs have been implicated in abiotic stress signaling and developmental events in various plants species. Genome-wide analysis of PLA superfamily has been carried out in dicot plant Arabidopsis. A comprehensive genome-wide analysis of PLAs has not been presented yet in crop plant rice.

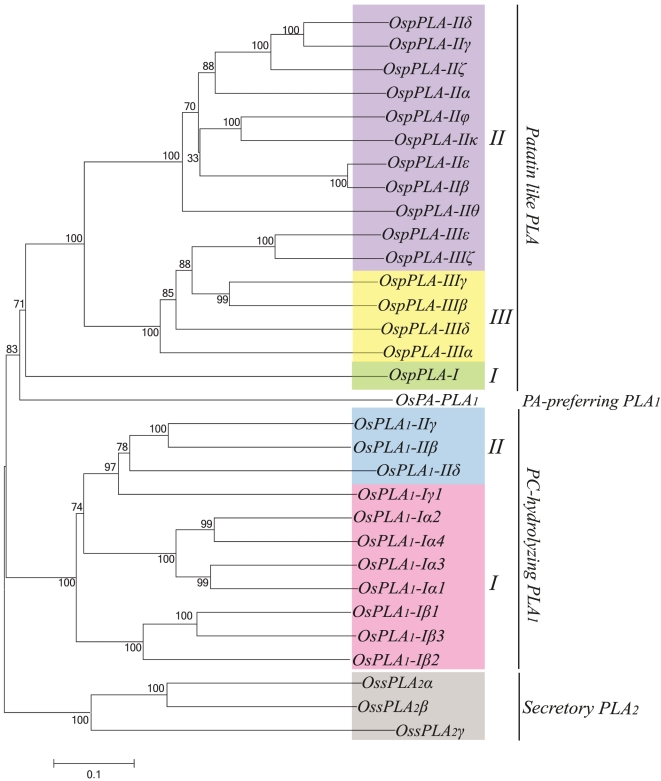
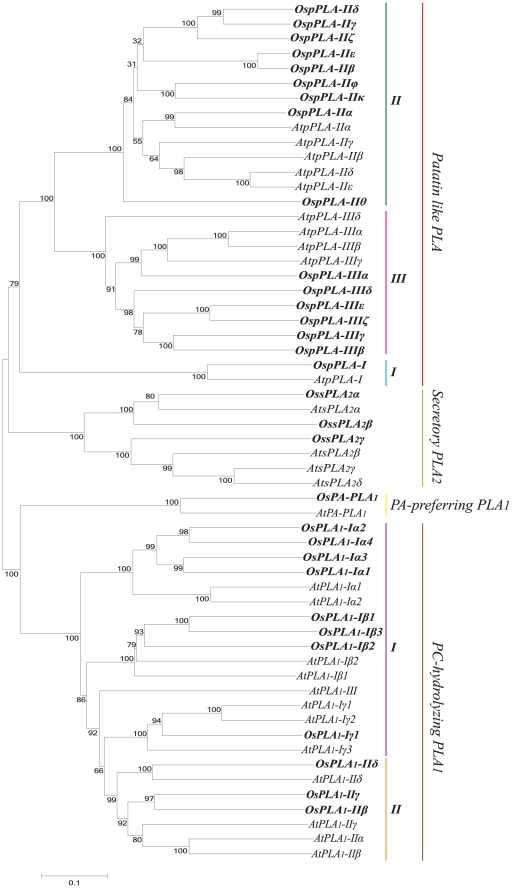
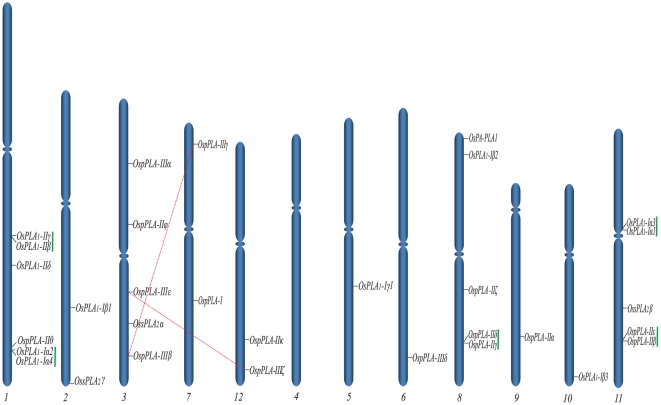
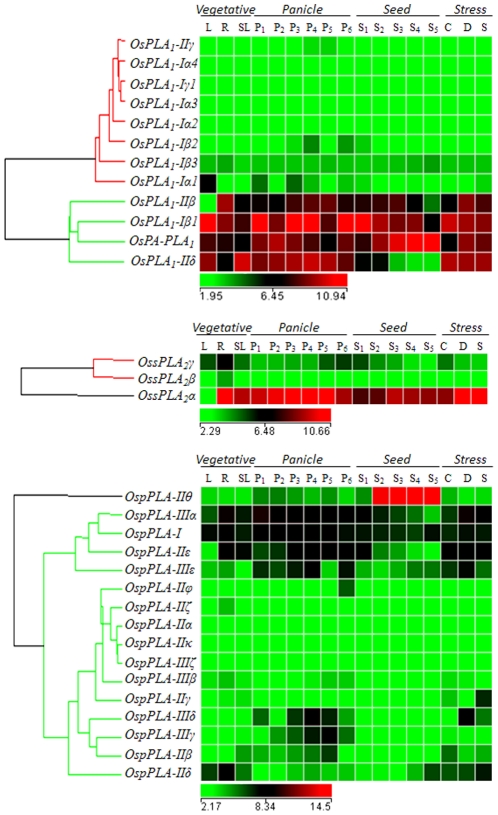
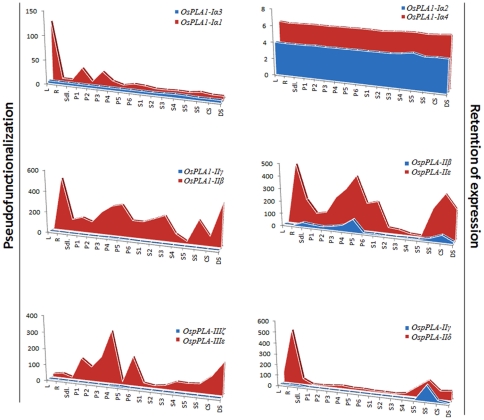
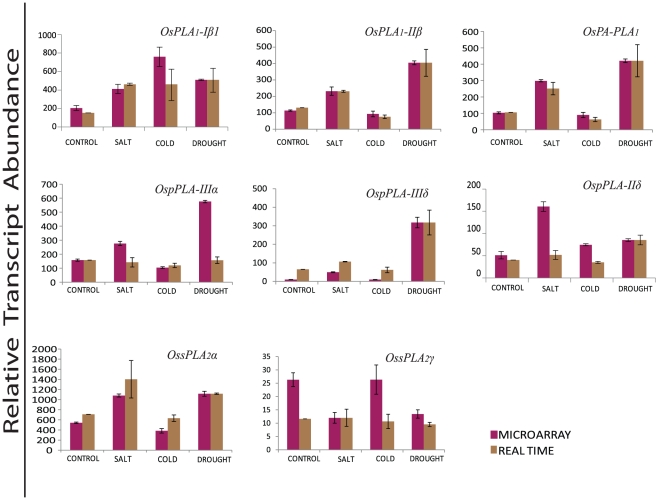
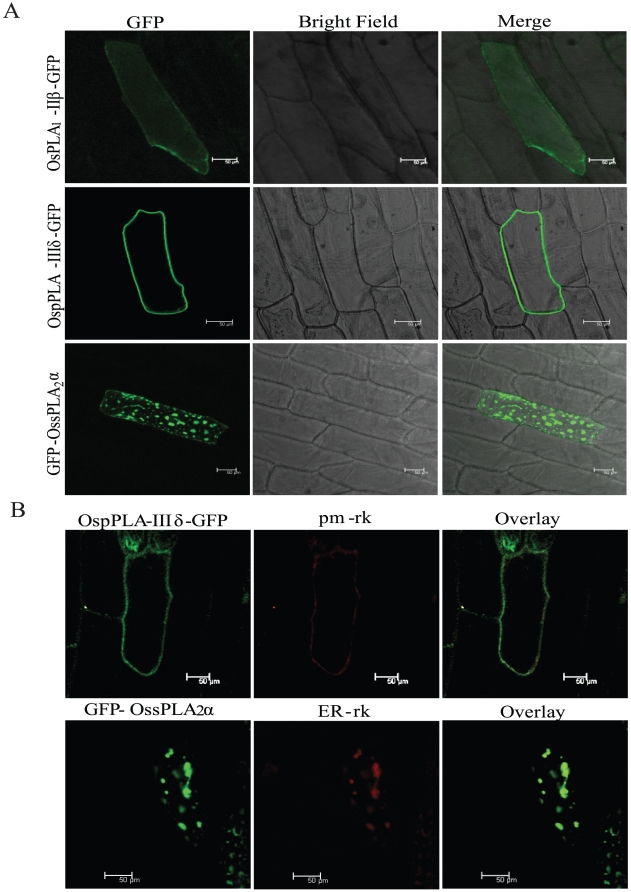
Methodology/principal findings: A comprehensive bioinformatics analysis identified a total of 31 PLA encoding genes in the rice genome, which are divided into three classes; phospholipase A(1) (PLA(1)), patatin like phospholipases (pPLA) and low molecular weight secretory phospholipase A(2) (sPLA(2)) based on their sequences and phylogeny. A subset of 10 rice PLAs exhibited chromosomal duplication, emphasizing the role of duplication in the expansion of this gene family in rice. Microarray expression profiling revealed a number of PLA members expressing differentially and significantly under abiotic stresses and reproductive development. Comparative expression analysis with Arabidopsis PLAs revealed a high degree of functional conservation between the orthologs in two plant species, which also indicated the vital role of PLAs in stress signaling and plant development across different plant species. Moreover, sub-cellular localization of a few candidates suggests their differential localization and functional role in the lipid signaling.

Conclusion/significance: The comprehensive analysis and expression profiling would provide a critical platform for the functional characterization of the candidate PLA genes in crop plants.


Conflict of interest statement

Competing Interests: The authors have declared that no competing interests exist.

Figures

Figure 1
Figure 1. Phylogenetic relationship among various classes of PLA superfamily in rice.
An un-rooted neighbor-joining tree was made from the protein sequences of all the PLA classes of rice. Multiple sequence alignment was done with ClustalX 2.0.8 and corresponding tree was generated in MEGA5. All the three PLA classes have been divided into subgroups (clades) indicated by different colors. Bootstrap value, out of 1000 replicates is indicated at each node. Scale bar represents 0.1 amino acid substitutions per site.
Figure 2
Figure 2. Phylogenetic relationship between rice and Arabidopsis PLA superfamily.
An un-rooted neighbor-joining tree was made from the total protein sequences of rice and Arabidopsis PLAs (PLA1, pPLA and sPLA2). Multiple sequence alignment was done using clustalX 2.0.8 and tree was generated using MEGA5. PLAs from rice and Arabidopsis are grouped, based on the bootstrap support value ≥50%. Scale bar represents 0.1 amino acid substitutions per site.
Figure 3
Figure 3. Multiple sequence alignment of (A) OsPLA1 (B) OssPLA2 and (C) OspPLA showing the consensus and conserved motifs.
Protein sequences were aligned for each PLA class, separately applying clustalW tool of Megalign-DNA STAR. The consensus and conserved sequences have been shown in shadow boxes. Catalytically important residues have been indicated by the black arrowheads. Putative His residues of catalytic centre in PLA1 (A) have been indicated by gray arrowheads.
Figure 4
Figure 4. Chromosomal localization of PLA genes on 12 chromosomes of rice.
Genes from different PLA classes have been mapped by their position on 12 chromosomes. Dashed red lines join the genes, lying on duplicated segments of the genome. Tandemly duplicated genes are joined with vertical green lines. Chromosomes are grouped randomly to show the duplication with clarity. No PLA gene was localized to chromosome 4. Respective chromosome numbers are mentioned at the bottom.
Figure 5
Figure 5. Expression profiles of rice PLA superfamily.
Different PLA class expression has been represented by a separate heat map. Reproductive development comprising six stages of panicle [P1 (0–3 cm), P2 (3–5 cm), P3 (5–10 cm), P4 (10–15 cm), P5 (15–22 cm), and P6 (22–30 cm)] and five stages of seed [S1 (0–2 DAP), S2 (3–4 DAP), S3 (4–10 DAP), S4 (11–20 DAP) and S5 (21–29 DAP)]. Clustering of the expression profile was done with log transformed average values taking mature leaf as base line. Three experimental stress conditions are denoted as C: Cold Stress, D: Drought Stress, S: Salt Stress and SL: control, seven day old unstressed seedling. A gene is considered differentially expressed during reproductive development if up- or down-regulated at least two-fold, with respect to the three vegetative controls (mature leaf, root and 7- day old seedling) and with respect to the seven day old unstressed seedling in case of abiotic stress. The color scale at the bottom of each heat map is given in log2 intensity value.
Figure 6
Figure 6. Expression pattern of duplicated PLA genes.
The expression values of segmentally and tandemly duplicated genes obtained from microarray data were compared in leaf (L), root (R) and seven day old seedling (SDL) tissue, in various stages of panicle development (P1–P6), seed development (S1–S5) and under cold stress (CS), dehydration stress (DS) and salt stress (SS). Each area graph represents compilation of the mean normalized signal intensity values from 17 stages of development/stress conditions. Gene pairs have been grouped into retention of expression and pseudo-functionalization based on their respective profile.
Figure 7
Figure 7. Validation of microarray expression profiles for selected PLA candidate genes by quantitative RT-PCR.
Real time PCR and microarray analysis was performed taking two and three biological replicates, respectively. Standard error bars have been shown for data obtained both from microarray and real time PCR. Y-axis represents raw expression values from microarray and normalized expression value from real time PCR and X-axis shows different experimental conditions; purple bars represent the expression from microarrays, while brown bars represent the real-time PCR values.
Figure 8
Figure 8. Sub-cellular localization of OsPLA proteins.
(A). Onion peel epidermal cells showing expression of the OsPLA - green fluorescent (GFP) fusion protein driven by the 35S promoter. Confocal images of fluorescence are shown for the expression of OsPLA1-IIβ-GFP fusion protein, showing its distribution throughout the cytoplasm (upper row), expression of OspPLA-IIIδ-GFP fusion protein showing their preferential accumulation in cell periphery (middle row) and of GFP-OssPLA-2α fusion in specific organelle in the cell (lower row). All the images were taken in 5 different sections in z direction and merges together. Scale bar = 50 µm. (B). Co-localization of PLA proteins with organelle markers. OspPLA-IIIδ-GFP showing GFP signal merges completely with plasma membrane marker (pm-rk) (upper panel) and GFP-OssPLA-2α was present as a large bright spot that co-localize with endoplasmic reticulum (ER) marker (ER-rk) (lower panel). GFP fusion to the OsPLA proteins are shown in green, mCherry organelle markers are shown in red and overlay of two mentioned protein in dark field view. All the images were taken in 5 different sections in z direction and merges together. Scale bar = 50 µm.

Similar articles

Cited by

References

    1. Munnik T, Meijer HJ. Osmotic stress activates distinct lipid and MAPK signalling pathways in plants. FEBS Lett. 2001;498:172–178. - PubMed
    1. Xiong L, Schumaker KS, Zhu JK. Cell signaling during cold, drought, and salt stress. Plant Cell. 2002;14(Suppl):S165–183. - PMC - PubMed
    1. Zhu JK. Salt and drought stress signal transduction in plants. Annu Rev Plant Biol. 2002;53:247–273. - PMC - PubMed
    1. Yamaguchi-Shinozaki K, Shinozaki K. Transcriptional regulatory networks in cellular responses and tolerance to dehydration and cold stresses. Annu Rev Plant Biol. 2006;57:781–803. - PubMed
    1. Hong Y, Pan X, Welti R, Wang X. Phospholipase Dalpha3 is involved in the hyperosmotic response in Arabidopsis. Plant Cell. 2008;20:803–816. - PMC - PubMed

Publication types

MeSH terms