

Proteomic analyses reveal high expression of decorin and endoplasmin (HSP90B1) are associated with breast cancer metastasis and decreased survival
- PMID: 22363530
- PMCID: PMC3282708
- DOI: 10.1371/journal.pone.0030992
Proteomic analyses reveal high expression of decorin and endoplasmin (HSP90B1) are associated with breast cancer metastasis and decreased survival
Abstract
Background: Breast cancer is the most common malignancy among women worldwide in terms of incidence and mortality. About 10% of North American women will be diagnosed with breast cancer during their lifetime and 20% of those will die of the disease. Breast cancer is a heterogeneous disease and biomarkers able to correctly classify patients into prognostic groups are needed to better tailor treatment options and improve outcomes. One powerful method used for biomarker discovery is sample screening with mass spectrometry, as it allows direct comparison of protein expression between normal and pathological states. The purpose of this study was to use a systematic and objective method to identify biomarkers with possible prognostic value in breast cancer patients, particularly in identifying cases most likely to have lymph node metastasis and to validate their prognostic ability using breast cancer tissue microarrays.
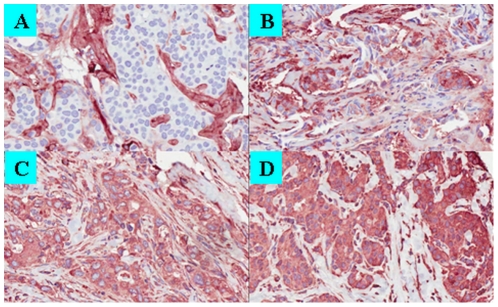
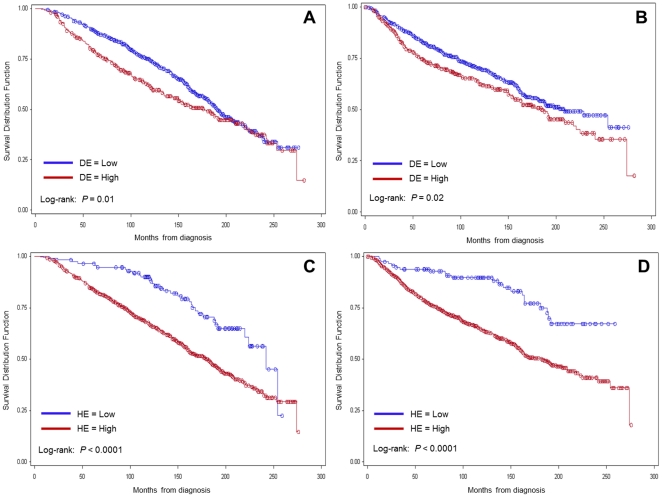
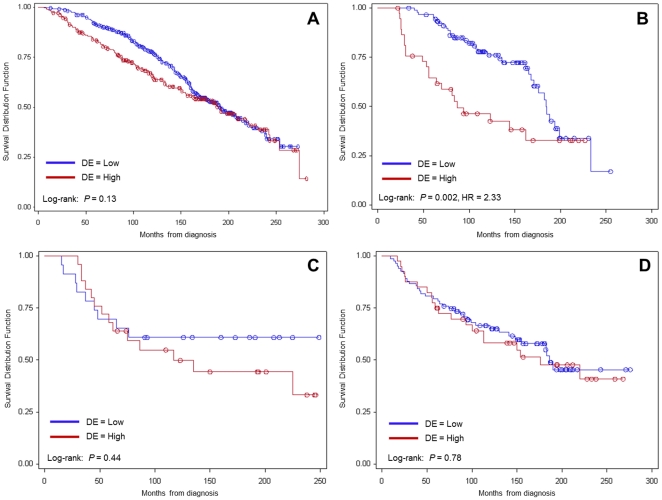
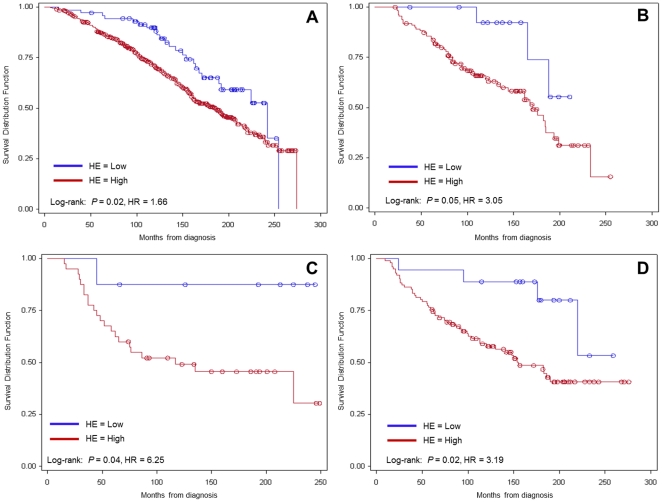
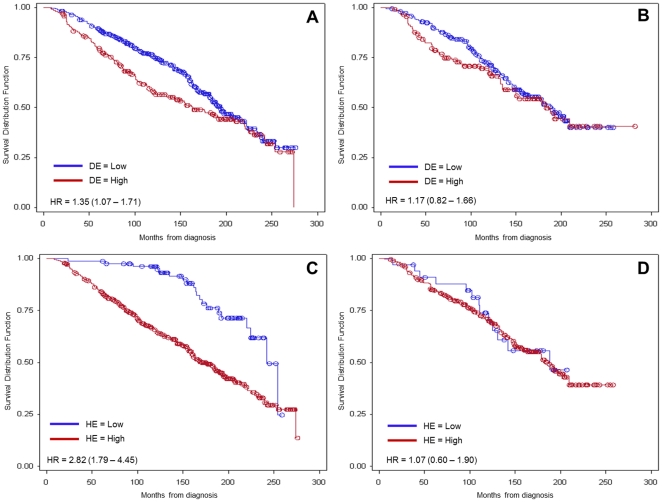
Methods and findings: Differential proteomic analyses were employed to identify candidate biomarkers in primary breast cancer patients. These analyses identified decorin (DCN) and endoplasmin (HSP90B1) which play important roles regulating the tumour microenvironment and in pathways related to tumorigenesis. This study indicates that high expression of Decorin is associated with lymph node metastasis (p<0.001), higher number of positive lymph nodes (p<0.0001) and worse overall survival (p = 0.01). High expression of HSP90B1 is associated with distant metastasis (p<0.0001) and decreased overall survival (p<0.0001) these patients also appear to benefit significantly from hormonal treatment.
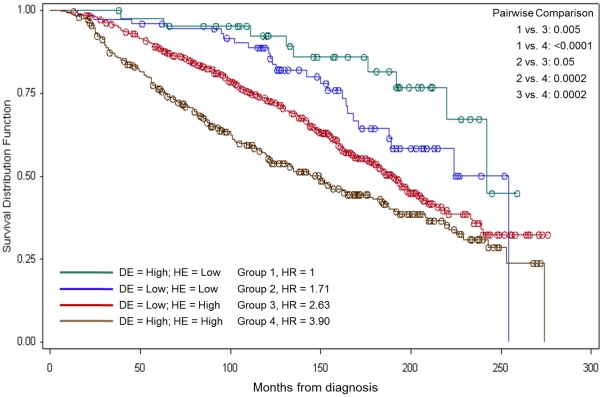
Conclusions: Using quantitative proteomic profiling of primary breast cancers, two new promising prognostic and predictive markers were found to identify patients with worse survival. In addition HSP90B1 appears to identify a group of patients with distant metastasis with otherwise good prognostic features.
Conflict of interest statement
Figures
References
-
- Forouzanfar MH, Foreman KJ, Delossantos AM, Lozano R, Lopez AD, et al. Breast and cervical cancer in 187 countries between 1980 and 2010: a systematic analysis. The Lancet. 2011;378:1461–1484. doi: 10.1016/S0140-6736(11)61351-2. - DOI - PubMed
-
- Carter C, Allen C, Henson D. Relation of tumor size, lymph node status, and survival in 24,740 breast cancer cases. Cancer. 1989;63:181–187. - PubMed
-
- Kell M, Winter D, O'Sullivan G, Shanahan F, Redmond H. Biological behaviour and clinical implications of micrometastases. Br J Surg. 2000;87:1629–39. - PubMed
-
- Cox C, White L, Allred N, Meyers M, Dickson D, et al. Survival outcomes in node-negative breast cancer patients evaluated with complete axillary node dissection versus sentinel lymph node biopsy. Ann Surg Oncol. 2006;13:708–711. doi: 10.1245/ASO.2006.05.017. - DOI - PubMed
-
- Kuijt GP, van de Poll-Franse LV, Voogd AC, Nieuwenhuijzen GAP, Roumen RMH. Survival after negative sentinel lymph node biopsy in breast cancer at least equivalent to after negative extensive axillary dissection. Eur J Surg Oncol. 2007;33:832–837. doi: 10.1016/j.ejso.2006.11.017. - DOI - PubMed
Publication types
MeSH terms
Substances
Grants and funding
LinkOut - more resources
Full Text Sources
Other Literature Sources
Medical
Miscellaneous
