. 2012;7(2):e31105.
doi: 10.1371/journal.pone.0031105. Epub 2012 Feb 17.

Modeling activity and target-dependent developmental cell death of mouse retinal ganglion cells ex vivo

Affiliations

Modeling activity and target-dependent developmental cell death of mouse retinal ganglion cells ex vivo

Sylvie Voyatzis et al. PLoS One. 2012.

Abstract

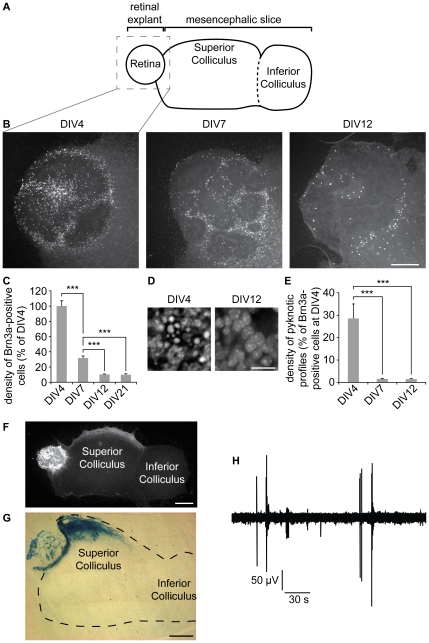
Programmed cell death is widespread during the development of the central nervous system and serves multiple purposes including the establishment of neural connections. In the mouse retina a substantial reduction of retinal ganglion cells (RGCs) occurs during the first postnatal week, coinciding with the formation of retinotopic maps in the superior colliculus (SC). We previously established a retino-collicular culture preparation which recapitulates the progressive topographic ordering of RGC projections during early post-natal life. Here, we questioned whether this model could also be suitable to examine the mechanisms underlying developmental cell death of RGCs. Brn3a was used as a marker of the RGCs. A developmental decline in the number of Brn3a-immunolabelled neurons was found in the retinal explant with a timing that paralleled that observed in vivo. In contrast, the density of photoreceptors or of starburst amacrine cells increased, mimicking the evolution of these cell populations in vivo. Blockade of neural activity with tetrodotoxin increased the number of surviving Brn3a-labelled neurons in the retinal explant, as did the increase in target availability when one retinal explant was confronted with 2 or 4 collicular slices. Thus, this ex vivo model reproduces the developmental reduction of RGCs and recapitulates its regulation by neural activity and target availability. It therefore offers a simple way to analyze developmental cell death in this classic system. Using this model, we show that ephrin-A signaling does not participate to the regulation of the Brn3a population size in the retina, indicating that eprhin-A-mediated elimination of exuberant projections does not involve developmental cell death.


Conflict of interest statement

Competing Interests: The authors have declared that no competing interests exist.

Figures

Figure 1
Figure 1. The number of Brn3a-expressing RGCs undergoes a reduction during the first postnatal week.
(A) P0, P3, and P7 retinal sections were immunostained with a Brn3a antibody. The inner surface of the retina (RGC layer) is down. The density of Brn3a-expressing cells decreases from P0 to P7 and the retinal ganglion cell layer reorganizes from a multiple cell layer at P0 to a single cell layer at P7. (B) The total number of Brn3a-positive RGCs in the retina declines between P0 and P7. n≥3 for each age. Error bar, s.e.m.; scale bar 50 µm; * p<0.05, ** p<0.01, Kruskall-Wallis test.
Figure 2
Figure 2. The number of photoreceptors and starburst amacrine cells increases during the first postnatal week.
(A) Recoverin and (B) ChAT immunoreactivity reveals photoreceptors and starburst amacrine cells respectively. Both cell types undergo an expansion of their population between P0 and P7. n≥3 for each age. Error bar, s.e.m.; scale bar 50 µm; * p<0.05, Kruskall-Wallis test.
Figure 3
Figure 3. The number of Brn3a-expressing cells in retino-collicular co-cultures decreases between DIV4 and DIV12.
(A) Schematic of the retino-collicular co-culture. A retinal explant is placed in contact with the rostral end of a parasagittal mesencephalic slice containing the SC. (B, C) The density of cells immunoreactive for Brn3a undergoes a reduction of ∼68% between DIV4 and DIV7, and a further decrease of ∼22% between DIV 7 and DIV12. No further reduction is observed between DIV12 and DIV21. The density measured for each age was normalized to the density of Brn3a-positive cells at 4DIV. (D, E) Density of dying cells revealed by the number of bisbenzimide-stained pyknotic profiles, and measured at DIV4, DIV7 and DIV12. The density of pyknotic profiles was normalized to the density of Brn3a-positive cells at DIV4 to coarsely estimate the percentage RGCs lost at each age. This estimation would only give an order of magnitude of the percentage of dying Brn3a-positive RGCs because only ∼30% of RGCs express Brn3a and other cell types are present in the retinal explant. (F) Axons from GFP expressing retinal explants invade the superficial layers of the SC at DIV12. (G) Projections from Brn3a-positive RGCs are detected in the SC using a retinal explant from a Brn3a-LacZ reporter mouse line. (H) Field electrophysiogical recording of the collicular slice at DIV12. Large bursts of spontaneous correlated activity are detected. B, scale bar 200 µm. D, scale bar 50 µm. F,G, scale bar 500 µm. Error bar, s.e.m.; n≥10 cultures per condition; *** p<0.001, ANOVA.
Figure 4
Figure 4. Photoreceptor and starburst amacrine cell populations expand in the retino-collicular co-cultures between DIV4 and DIV12.
(A) Recoverin and (B) ChAT immunoreactivity reveals photoreceptors and starburst amacrine cells respectively in the retinal explant of retino-collicular co-cultures. Both cell types undergo an expansion between DIV4 and DIV12. Scale bar 100 µm; Error bar, s.e.m.; n≥7 cultures per condition; *** p<0.001, ANOVA. (C) Reorganization of the retinal explant ex vivo. At DIV4, RGCs (orange) and photoreceptors (blue) are mixed in the explant. After 12 days in vitro, RGCs are preferentially located at the border of the retinal explant, while photoreceptors form rosette-like structures in the center of the explant. ChAT amacrine cells (red) are positioned between RGCs and photoreceptors.
Figure 5
Figure 5. Blockade of electrical activity limits the reduction in the number of Brn3a-expressing cells.
(A) TTX treatment prevents the retinotopic organization of axonal arbors ex vivo. Temporal axons arborize in the rostral SC in control conditions. In contrast, electrical activity blockade with TTX abolishes the preference of axons from the temporal retina for the anterior SC as described in . Grey circles symbolize Brn3a-positive RGCs and their density is representative of the number of Brn3a-labeled cells in each condition. (B) Incubation of retino-collicular co-cultures in the sodium channel blocker TTX increases the number of Brn3a-immunoreactive cells in retinal explants at DIV12. (C) TTX treatment causes a ∼64% increase in the number of Brn3a-expressing cells at DIV12. Error bar, s.e.m.; Scale bar 200 µm; n≥22 cultures per condition; *** p<0.001, ANOVA.
Figure 6
Figure 6. Increasing the size of the target reduces the elimination of Brn3a-expressing cells.
(A) The modulation of target availability was achieved by increasing the number of mesencephalic slices in contact with the retinal explant. Grey circles symbolize Brn3a-positive RGCs and their density is representative of the number of Brn3a-labeled cells in each condition. (B) The density of Brn3a-immunoreactive cells in retinal explants confronted with 2 (2 SC) or 4 (4 SC) collicular slices was increased by ∼153% and ∼280% respectively at DIV12 in comparison with parallel cultures with a single collicular slice. (C) Axonal arbors from GFP-expressing retinas are detected in the superior colliculus of all mesencephalic slices that are available to them. Error bar, s.e.m.; Scale bar 50 µm; n≥10 cultures per condition; ** p<0.01, *** p<0.001, ANOVA.
Figure 7
Figure 7. Blockade of ephrin-A signaling does not affect Brn3a-expressing cell number reduction.
(A) Ephrin-A5 treatment prevents the retinotopic organization of axonal arbors ex vivo, as described in . Temporal axons arborize in the rostral SC in control conditions. In contrast, overall activation of ephrin-A/EphA signaling with ephrin-A5 abolishes the preference of axons from the temporal retina for the anterior SC. Grey circles symbolize Brn3a-positive RGCs and their density is representative of the number of Brn3a-labeled cells in each condition. (B, C) The density of Brn3a-immunoreactive cells in retinal explants is not affected by application of ephrin-A5 between DIV1 and DIV12 (0.5 µg/µl). Error bar, s.e.m.; Scale bar 200 µm; n≥40 cultures per condition; ns, not significant, ANOVA.

Similar articles

Cited by

References

    1. Buss RR, Sun W, Oppenheim RW. Adaptive roles of programmed cell death during nervous system development. Annu Rev Neurosci. 2006;29:1–35. - PubMed
    1. Vecino E, Hernández M, García M. Cell death in the developing vertebrate retina. Int J Dev Biol. 2004;48:965–974. - PubMed
    1. Young RW. Cell death during differentiation of the retina in the mouse. J Comp Neurol. 1984;229:362–373. - PubMed
    1. Young RW. Cell proliferation during postnatal development of the retina in the mouse. Brain Res. 1985;353:229–239. - PubMed
    1. Galli-Resta L, Ensini M. An intrinsic time limit between genesis and death of individual neurons in the developing retinal ganglion cell layer. J Neurosci. 1996;16:2318–2324. - PMC - PubMed

Publication types

MeSH terms

LinkOut - more resources