. 2012;7(2):e31231.
doi: 10.1371/journal.pone.0031231. Epub 2012 Feb 17.

Prohibitin 1 modulates mitochondrial stress-related autophagy in human colonic epithelial cells

Affiliations

Prohibitin 1 modulates mitochondrial stress-related autophagy in human colonic epithelial cells

Arwa S Kathiria et al. PLoS One. 2012.

Abstract

Introduction: Autophagy is an adaptive response to extracellular and intracellular stress by which cytoplasmic components and organelles, including damaged mitochondria, are degraded to promote cell survival and restore cell homeostasis. Certain genes involved in autophagy confer susceptibility to Crohn's disease. Reactive oxygen species and pro-inflammatory cytokines such as tumor necrosis factor α (TNFα), both of which are increased during active inflammatory bowel disease, promote cellular injury and autophagy via mitochondrial damage. Prohibitin (PHB), which plays a role in maintaining normal mitochondrial respiratory function, is decreased during active inflammatory bowel disease. Restoration of colonic epithelial PHB expression protects mice from experimental colitis and combats oxidative stress. In this study, we investigated the potential role of PHB in modulating mitochondrial stress-related autophagy in intestinal epithelial cells.

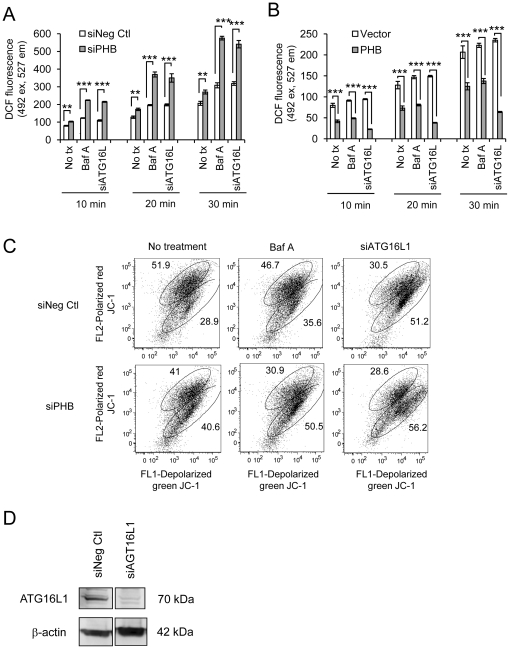
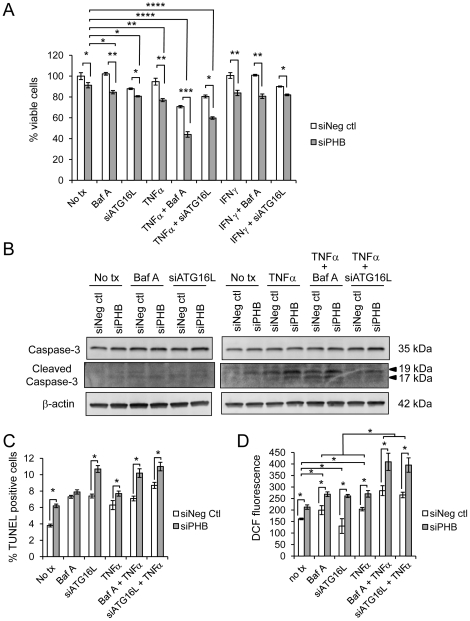
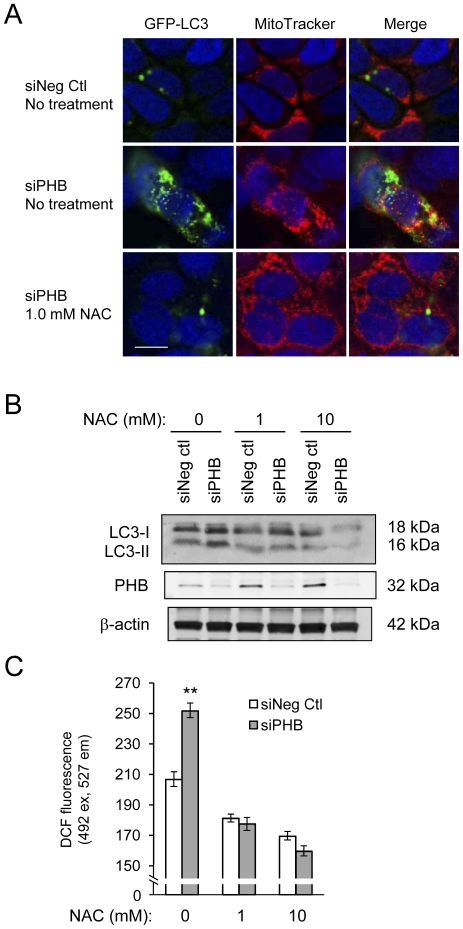
Methods: We measured autophagy activation in response to knockdown of PHB expression by RNA interference in Caco2-BBE and HCT116 WT and p53 null cells. The effect of exogenous PHB expression on TNFα- and IFNγ-induced autophagy was assessed. Autophagy was inhibited using Bafilomycin A(1) or siATG16L1 during PHB knockdown and the affect on intracellular oxidative stress, mitochondrial membrane potential, and cell viability were determined. The requirement of intracellular ROS in siPHB-induced autophagy was assessed using the ROS scavenger N-acetyl-L-cysteine.

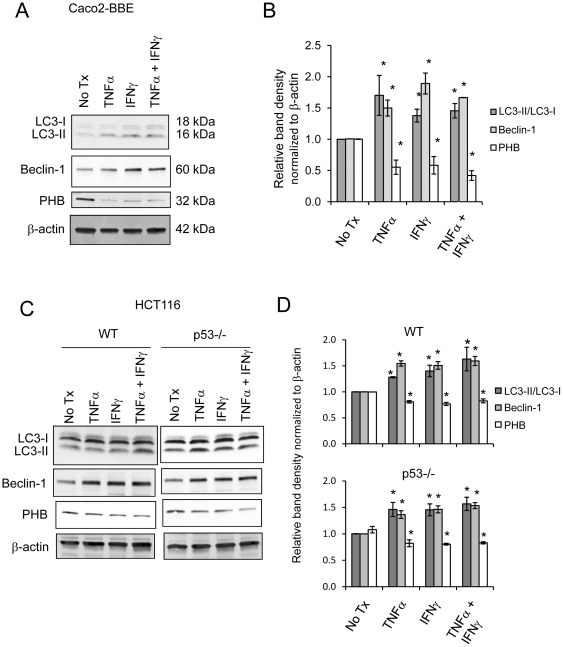
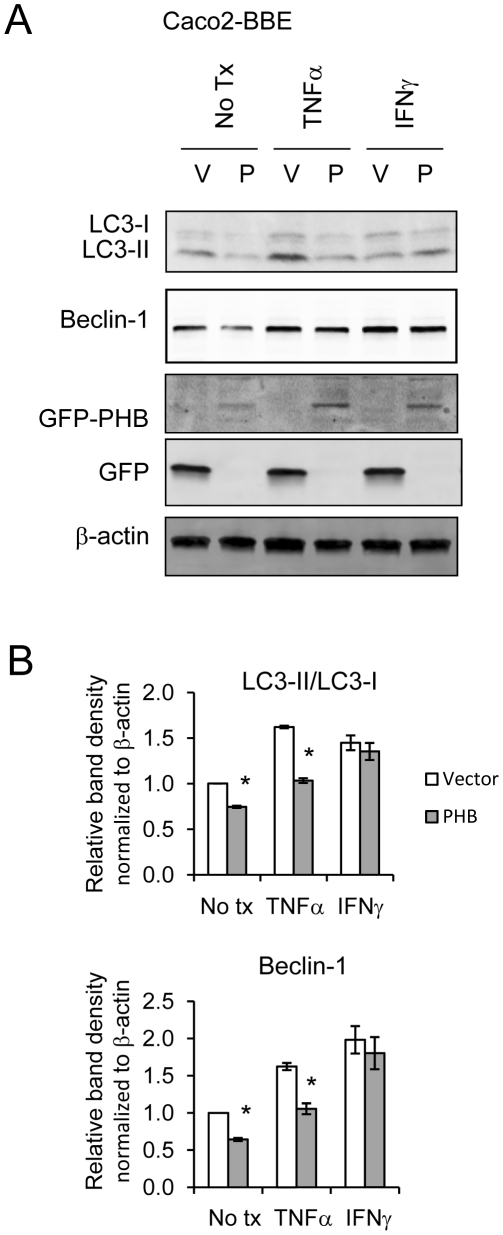
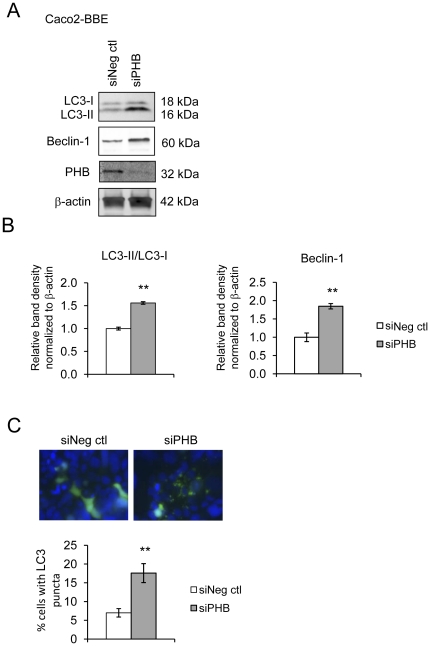
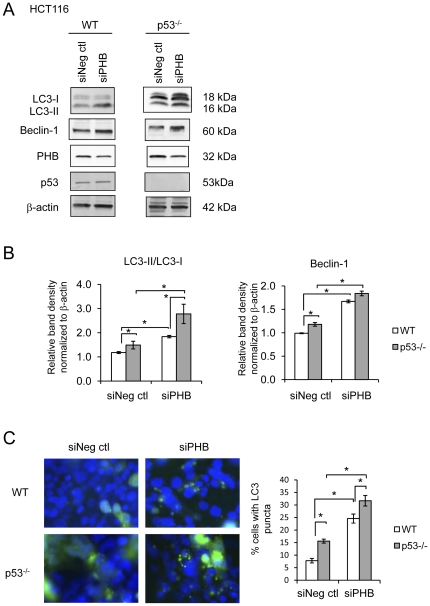
Results: TNFα and IFNγ-induced autophagy inversely correlated with PHB protein expression. Exogenous PHB expression reduced basal autophagy and TNFα-induced autophagy. Gene silencing of PHB in epithelial cells induces mitochondrial autophagy via increased intracellular ROS. Inhibition of autophagy during PHB knockdown exacerbates mitochondrial depolarization and reduces cell viability.

Conclusions: Decreased PHB levels coupled with dysfunctional autophagy renders intestinal epithelial cells susceptible to mitochondrial damage and cytotoxicity. Repletion of PHB may represent a therapeutic approach to combat oxidant and cytokine-induced mitochondrial damage in diseases such as inflammatory bowel disease.


Conflict of interest statement

Competing Interests: The authors have declared that no competing interests exist.

Figures

Figure 1
Figure 1. PHB protein levels inversely correlate with cytokine-induced autophagy in cultured colonic epithelial cells.
(A) Representative Western blots showing LC3I/LC3II, Beclin-1, PHB or β-actin (loading control) expression in Caco2-BBE cells treated with 10 ng/ml TNFα or 50 ng/ml IFNγ alone or in combination for 18 hours. (B) Histograms show mean ± SEM relative to no treatment control Caco2-BBE cells. *P<0.05 vs. no tx; n = 3. (C) Representative Western blots showing LC3I/LC3II, Beclin-1, PHB or β-actin (loading control) expression in HCT116 cells treated with 10 ng/ml TNFα or 50 ng/ml IFNγ alone or in combination for 18 hours. (D) Histograms show mean ± SEM relative to no treatment control HCT116 cells. *P<0.05 vs. no tx; n = 3.
Figure 2
Figure 2. Exogenous PHB expression reduces basal autophagy and TNFα-induced autophagy in intestinal epithelial cells.
(A) Representative Western blots of 3 independent experiments showing LC3I/LC3II, Beclin-1, GFP-PHB, GFP or β-actin (loading control) expression in Caco2-BBE cells transfected with either pEGFPN1 expression vector (V) or pEGFPN1-PHB (P) and treated with 10 ng/ml TNFα or 50 ng/ml IFNγ for 18 hours. (B) Histograms show mean ± SEM relative to no treatment control cells. *P<0.05 vs. no tx; n = 3.
Figure 3
Figure 3. Knockdown of PHB induces autophagy.
Markers of autophagy were assessed in Caco2-BBE cells transfected with either siNeg ctl or siPHB for 96 hours. (A) Representative Western blots showing LC3I/LC3II, Beclin-1 or β-actin (loading control) expression. PHB protein levels were assessed to determine efficiency of knockdown. (B) Histograms show mean ± SEM. **P<0.01 vs. siNeg ctl; n = 3 (C) Fluorescent micrographs of cells expressing pSelect-GFP-LC3 (green) and stained with DAPI (blue) to visualize nuclei. Quantification of cells with punctuate GFP-LC3. Histograms show mean ± SEM. **P<0.01 vs. siNeg ctl, n ≥ 5 fields with >50 cells/field.
Figure 4
Figure 4. Knockdown of PHB using siRNA induces autophagy independently of p53 in HCT116 cells.
Markers of autophagy were assessed in HCT116 cells transfected with either siNeg ctl or siPHB for 96 hours. (A) Representative Western blot showing LC3I/LC3II , Beclin-1 or β-actin (loading control) expression. PHB protein levels were assessed to determine efficiency of knockdown. (B) Histograms show mean ± SEM relative to no treatment control cells. *P<0.05 vs. siNeg ctl; n = 3. (C) Fluorescent micrographs of cells expressing pSelect-GFP-LC3 (green) and stained with DAPI (blue) to visualize nuclei. Quantification of cells with punctuate GFP-LC3. Histograms show mean ± SEM. *P<0.05 vs. siNeg ctl, n = 5 fields with >50 cells/field.
Figure 5
Figure 5. PHB knockdown increases intracellular reactive oxygen species and induces mitochondrial depolarization.
(A) DCF fluorescence was measured in Caco2-BBE cells transfected with siRNA for 96 hours and treated as indicated for 18 hours. Cells were loaded with DCFH-DA for 10 minutes and fluorescence was determined 10, 20 and 30 minutes after loading using a plate reader to assess intracellular ROS levels. **P<0.01, ***P<0.001; n = 16 from two separate experiments. (B) DCF fluorescence was measured in Caco2-BBE cells stably transfected with pEGFPN1 expression vector or pEGFPN1-PHB as in (A). ***P<0.001; n = 8. (C) Mitochondrial membrane depolarization was measured in Caco2-BBE cells stained with JC-1 dye as demonstrated by a shift from red (intact MMP) to green (depolarized) fluorescence detected by flow cytometry. The data shown are a representative result from one of three experiments. (D) ATG16L1 protein levels were assessed by Westen blotting to determine efficiency of knockdown.
Figure 6
Figure 6. Silencing of PHB expression reduces cell viability.
(A) Cytotoxicity as measured by LDH test of Caco2-BBE cells transfected with siRNA for 96 hours and treated as indicated for 18 hours. *P<0.05, **P<0.01, ***P<0.001; ****P<0.0001 vs. all other treatments; n = 3 experiments run in quadruplicate. (B) Representative Western blot showing cleaved Caspase-3 or β-actin (loading control) expression. (C) Percent TUNEL-positive Caco2-BBE cells. A minimum of 5 fields were counted for each treatment. *P<0.05. (D) DCF fluorescence was measured in Caco2-BBE cells transfected with siRNA for 96 hours and treated as indicated for 18 hours. Cells were loaded with DCFH-DA for 10 minutes and fluorescence was determined 10 minutes after loading. *P<0.05; n = 8.
Figure 7
Figure 7. Treatment with NAC, a ROS scavenger, prevents siPHB-induced mitochondrial stress-related autophagy.
(A) Caco2-BBE cells were co-transfected with siPHB or siNeg Ctl and GFP-LC3 (green fluorescence) and incubated with MitoTracker dye (red fluorescence, mitochondria). Cells were incubated with 1.0 mM NAC for 24 hours prior to collection. Merged confocal images demonstrate mitophagy (yellow fluorescence). Cells were stained with DAPI to visualize nuclei (blue). Bar = 10 µM. (B) Representative Western blot showing LC3I/LC3II or β-actin (loading control) expression. The data shown are a representative result from one of three experiments. (C) DCF fluorescence was measured in Caco2-BBE cells transfected with siPHB for 96 hours and treated with NAC for 18 hours. Cells were loaded with DCFH-DA for 10 minutes and fluorescence was determined 20 minutes after loading using a plate reader to assess intracellular ROS levels. **P<0.01, n = 8.

Similar articles

Cited by

References

    1. Dalby KN, Tekedereli I, Lopez-Berestein G, Ozpolat B. Targeting the prodeath and prosurvival functions of autophagy as novel therapeutic strategies in cancer. Autophagy. 2010;6:322–329. - PMC - PubMed
    1. Gurusamy N, Das DK. Autophagy, redox signaling, and ventricular remodeling. Antioxid Redox Signal. 2009;11:1975–1988. - PMC - PubMed
    1. Mizushima N, Levine B, Cuervo AM, Klionsky DJ. Autophagy fights disease through cellular self-digestion. Nature. 2008;451:1069–1075. - PMC - PubMed
    1. Beau I, Mehrpour M, Codogno P. Autophagosomes and human diseases. Int J Biochem Cell Biol. 2011;43:460–464. - PubMed
    1. Glick D, Barth S, Macleod KF. Autophagy: cellular and molecular mechanisms. J Pathol. 2010;221:3–12. - PMC - PubMed

Publication types

MeSH terms