. 2012;7(2):e31275.
doi: 10.1371/journal.pone.0031275. Epub 2012 Feb 20.

Lesions to primary sensory and posterior parietal cortices impair recovery from hand paresis after stroke

Affiliations

Lesions to primary sensory and posterior parietal cortices impair recovery from hand paresis after stroke

Eugenio Abela et al. PLoS One. 2012.

Abstract

Background: Neuroanatomical determinants of motor skill recovery after stroke are still poorly understood. Although lesion load onto the corticospinal tract is known to affect recovery, less is known about the effect of lesions to cortical sensorimotor areas. Here, we test the hypothesis that lesions of somatosensory cortices interfere with the capacity to recover motor skills after stroke.

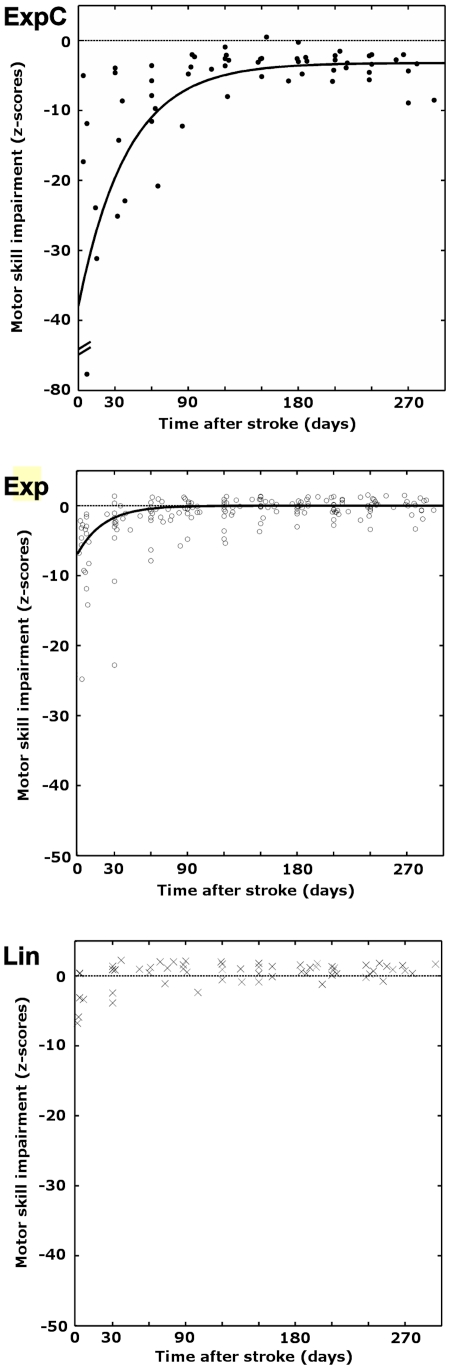
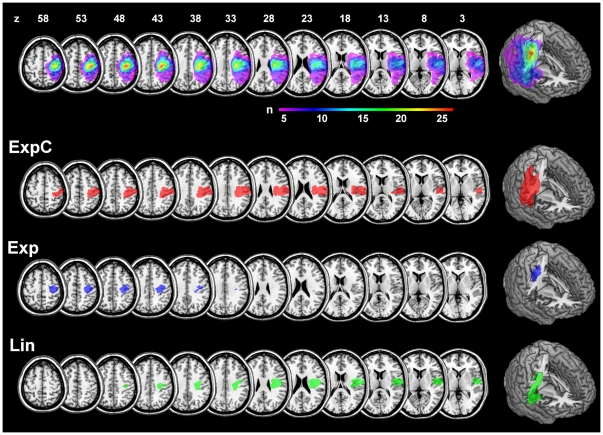
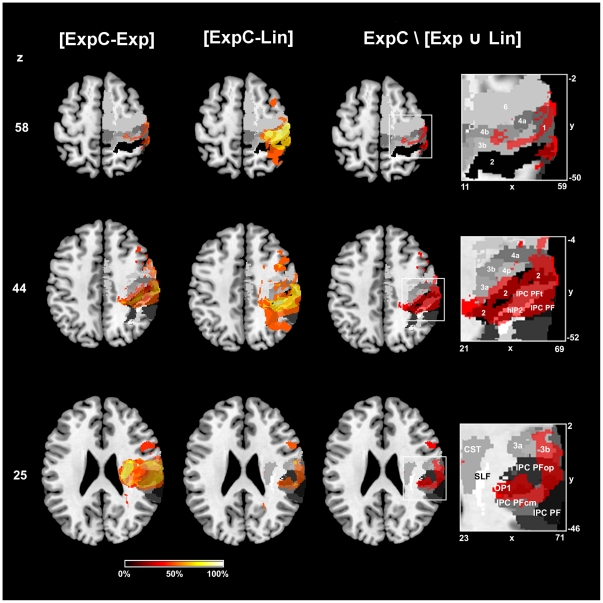
Methods: Standardized tests of motor skill and somatosensory functions were acquired longitudinally over nine months in 29 patients with stroke to the pre- and postcentral gyrus, including adjacent areas of the frontal, parietal and insular cortices. We derived the recovery trajectories of each patient for five motor subtest using least-squares curve fitting and objective model selection procedures for linear and exponential models. Patients were classified into subgroups based on their motor recovery models. Lesions were mapped onto diffusion weighted imaging scans and normalized into stereotaxic space using cost-function masking. To identify critical neuranatomical regions, voxel-wise subtractions were calculated between subgroup lesion maps. A probabilistic cytoarchitectonic atlas was used to quantify of lesion extent and location.

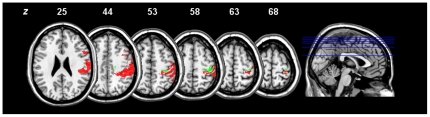
Results: Twenty-three patients with moderate to severe initial deficits showed exponential recovery trajectories for motor subtests that relied on precise distal movements. Those that retained a chronic motor deficit had lesions that extended to the center of the somatosensory cortex (area 2) and the intraparietal sulcus (areas hIP1, hIP2). Impaired recovery outcome correlated with lesion extent on this areas and somatosensory performance. The rate of recovery, however, depended on the lesion load onto the primary motor cortex (areas 4a, 4p).

Conclusions: Our findings support a critical role of uni-and multimodal somatosensory cortices in motor skill recovery. Whereas lesions to these areas influence recovery outcome, lesions to the primary motor cortex affect recovery dynamics. This points to a possible dissociation of neural substrates for different aspects of post-stroke recovery.


Conflict of interest statement

Competing Interests: The authors have declared that no competing interests exist.

Figures

Figure 1
Figure 1. Modeled subgroup recovery trajectories.
Scatterplots of subgroup motor impairment scores versus time post-stroke. Impairment scores are in unit standard deviation from the healthy population, where more negative values indicate increasing impairment. Subgroups are named according to the models that best fit their recovery curves. ExpC: patients with slow and impaired recovery (n = 6); Exp: patients with slow and complete recovery (n = 17), and Lin: patients with fast and complete recovery (n = 6). Black solid curves indicate weighted mean recovery trajectories. Dashed line indicates mean of control group performance (z-score = 0).
Figure 2
Figure 2. Anatomical overview.
Lesion overlap maps for all patients (upper-most row). Rows below show the core maps of subgroups ExpC, Exp and Lin overlaid onto on a standard single-subject brain template. Maps represent voxels were at least 90% of patients overlap (threshold for ExpC and Lin: n = 5; for Exp: n = 15). Images are in neurological convention (left side of the image is left side of the brain) and z-coordinates are given in MNI stereotaxic space. Right-most column shows three-dimensional renderings with a vertical cut through the maximum overlap of the complete cohort.
Figure 3
Figure 3. Lesion analysis using subtraction plots and probabilistic cyto- and myeloarchitectonic maps.
First and second column from left represent the subtraction of lesion overlap maps from all patients with impaired recovery outcome (ExpC) versus patients with unimpaired recovery (Exp) and complete recovery (Lin), respectively. Voxels lesioned at least 50% more frequently are shown for both subtractions, increasingly brighter colors indicating increased frequency of damage in subgroup A. Third column and magnified views show in monochromatic red the set difference ExpC\[Exp Lin] superimposed onto cyto- and myeloarchitectonic maximum probability maps (i.e. voxels that have the highest probability of belonging to a given area according to the Jülich histological atlas). This set difference corresponds to all voxels that exclusively belong to group ExpC and are thus associated with impaired recovery. Maps are in shades of grey (SLF in white, area 2 in black). All images are in neurological convention and MNI stereotaxic space. Axial slices are at the level of the hand motor area (z = 58), maximum of cortical damage in group ExpC (z = 44) and maximum of subcortical damage in group ExpC (z = 25). Abbreviations: 6 = premotor area 6; 4a/p = primary motor areas; 3a/b, 1, 2 = primary somatosensory areas (anterior to posterior); CST = corticospinal tract; hIP2 = human intraparietal sulcus 2; IPC = Inferior parietal cortex with subareas PF, PFt, PFop, PFcm; OP1 = opercular area 1; SLF = superior longitudinal fascicle. x/y/z = MNI coordinates in mm.
Figure 4
Figure 4. Comparison of lesion maps for impaired recovery outcome and slowed recovery rate.
Red areas correspond to voxels that are associated with impaired recovery (i.e. that are lesioned in the patient subgroup ExpC, but not in subgroups Exp and Lin). Green areas encompass those voxels that are damaged in both with exponential recovery subgroups (i.e. that are lesioned in the patient subgroups ExpC and Exp, but not Lin). Images are in neurological convention and MNI stereotaxic space. z = MNI coordinates in mm.

Similar articles

Cited by

References

    1. Lindenberg R, Renga V, Zhu LL, Betzler F, Alsop D, et al. Structural integrity of corticospinal motor fibers predicts motor impairment in chronic stroke. Neurology. 2010;74:280–287. - PMC - PubMed
    1. Zhu LL, Lindenberg R, Alexander MP, Schlaug G. Lesion load of the corticospinal tract predicts motor impairment in chronic stroke. Stroke. 2010;41:910–915. - PMC - PubMed
    1. Amunts K, Zilles K. Advances in cytoarchitectonic mapping of the human cerebral cortex. Neuroimaging Clin N Am. 2001;11:151–169, vii. - PubMed
    1. Eickhoff SB, Stephan KE, Mohlberg H, Grefkes C, Fink GR, et al. A new SPM toolbox for combining probabilistic cytoarchitectonic maps and functional imaging data. Neuroimage. 2005;25:1325–1335. - PubMed
    1. Papageorgiou E, Ticini LF, Hardiess G, Schaeffel F, Wiethoelter H, et al. The pupillary light reflex pathway: cytoarchitectonic probabilistic maps in hemianopic patients. Neurology. 2008;70:956–963. - PubMed

Publication types

MeSH terms