. 2012;7(2):e31290.
doi: 10.1371/journal.pone.0031290. Epub 2012 Feb 20.

Transmission of infectious diseases en route to habitat hotspots

Affiliations

Transmission of infectious diseases en route to habitat hotspots

Julio Benavides et al. PLoS One. 2012.

Abstract

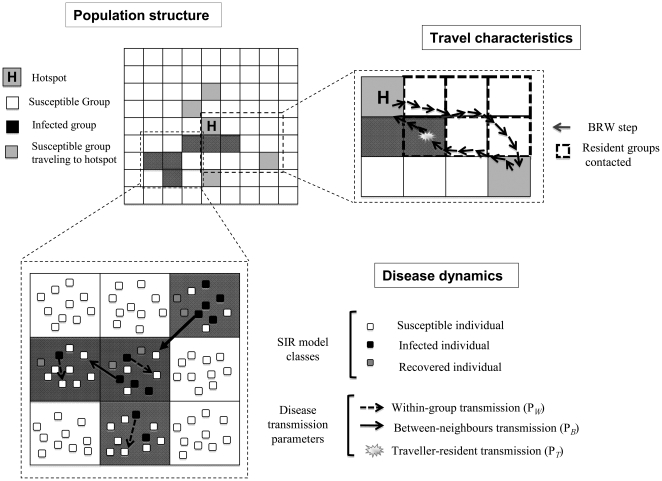
Background: The spread of infectious diseases in wildlife populations is influenced by patterns of between-host contacts. Habitat "hotspots"--places attracting a large numbers of individuals or social groups--can significantly alter contact patterns and, hence, disease propagation. Research on the importance of habitat hotspots in wildlife epidemiology has primarily focused on how inter-individual contacts occurring at the hotspot itself increase disease transmission. However, in territorial animals, epidemiologically important contacts may primarily occur as animals cross through territories of conspecifics en route to habitat hotspots. So far, the phenomenon has received little attention. Here, we investigate the importance of these contacts in the case where infectious individuals keep visiting the hotspots and in the case where these individuals are not able to travel to the hotspot any more.

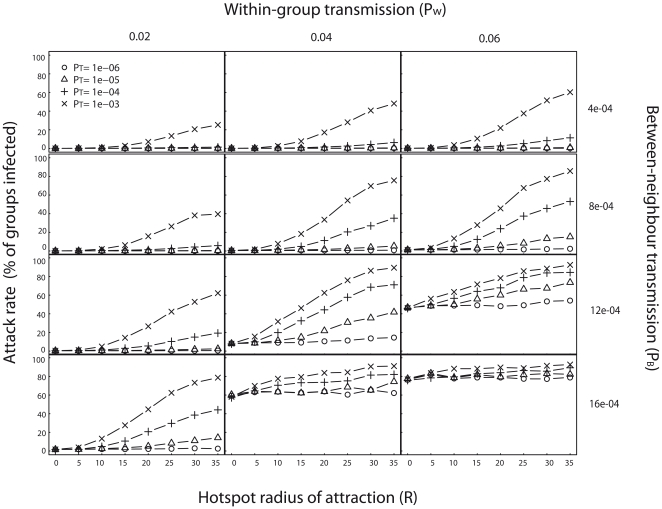
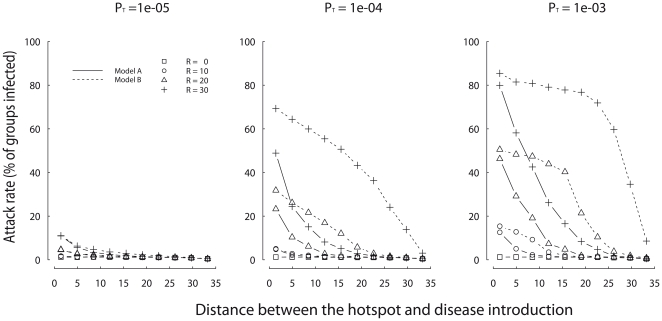
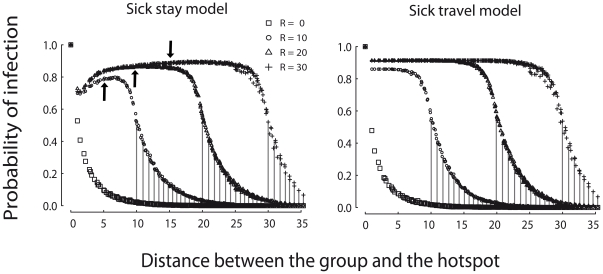
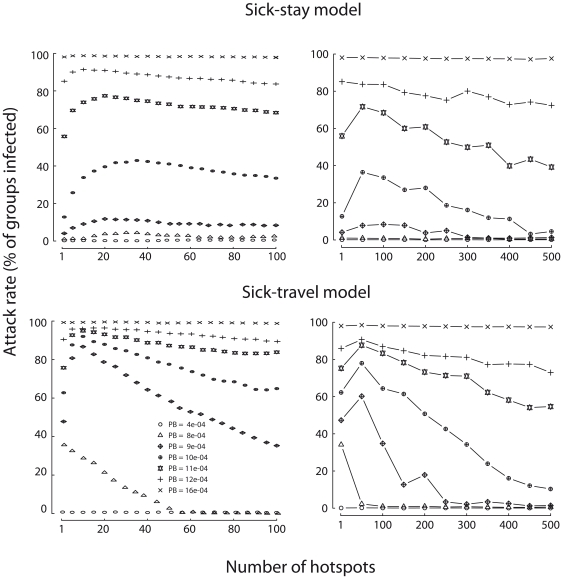
Methodology and principal findings: We developed a simulation epidemiological model to investigate both cases in a scenario when transmission at the hotspot does not occur. We find that (i) hotspots still exacerbate epidemics, (ii) when infectious individuals do not travel to the hotspot, the most vulnerable individuals are those residing at intermediate distances from the hotspot rather than nearby, and (iii) the epidemiological vulnerability of a population is the highest when the number of hotspots is intermediate.

Conclusions and significance: By altering animal movements in their vicinity, habitat hotspots can thus strongly increase the spread of infectious diseases, even when disease transmission does not occur at the hotspot itself. Interestingly, when animals only visit the nearest hotspot, creating additional artificial hotspots, rather than reducing their number, may be an efficient disease control measure.


Conflict of interest statement

Competing Interests: The authors have declared that no competing interests exist.

Figures

Figure 1
Figure 1. Model schematic.
The hotspot is located at the center of a 51×51 lattice. All other cells correspond to a group's territory. Groups with at least one infected individual are considered infected, indicated in dark grey. A 9×9 section of the lattice depicts the SIR transmission dynamics among individuals that are either in the same group or neighbouring groups (bottom). Groups follow Biased Random Walks (BRW) during their daylong trips to the hotspot (top right). Transmission is possible between a travelling group and the groups residing in cells traversed en route to the hotspot.
Figure 2
Figure 2. Influence of multiple model parameters on attack rate, when infected groups do not travel (Sick-stay model).
The fraction of groups infected increases with the hotspot radius of attraction, but varies with the traveler-resident transmission probability PT (four lines in each graph), within-group transmission probability Pw (three different columns of graphs), and between-neighbour transmission probability PB (four different rows of graphs). Each value is based on 1000 simulations in which disease was introduced randomly in one of the eigth groups adjacent to the hotspot.
Figure 3
Figure 3. Attack rate decreases with the distance between the hotspot and point of disease introduction.
Sick-stay model (solid lines) and Sick-travel model (dashed lines) are compared for different values of the hotspot radius of attraction (R). Each graph presents a different value of the traveler-resident transmission rate (PT). Each value is averaged over 1000 stochastic simulations, assuming PB = 8e-04 and Pw = 0.06.
Figure 4
Figure 4. Probability of infection depends on distance to hotspot.
The relationship is presented for different values of the hotspot radius of attraction (R) in Sick-stay model (left) and Sick-travel model (right). Vertical lines compare the probability of infection when there is no hotspot (R = 0) to the probability of infection when there is a hotspot (R>0), for groups residing beyond the radius of attraction (distance to hotspot greater than R). This quantifies the indirect epidemiological impact of the hotpot on groups that never travel themselves or encounter travelers en route to the hotspot. Black arrows show the analytical prediction of the most vulnerable group to disease for R = 10, 20 and 30 respectively. Parameter values are PB = 8e-04, PT = 0.001 and Pw = 0.06. Each value is based on 1000 stochastic simulations in which disease was introduced randomly in one of the eight groups adjacent to the hotspot. Results for other parameter values are shown in Fig. S2 and S3.
Figure 5
Figure 5. Number of hotspots.
Each line graphs the change in attack rate as a function of the number of hotspots, for a different value of PB (from 4e-04 to 16e-04). Results are presented for hotspots ranging from 1–100 (left) and 1–500 (right) in the Sick-stay model (top) and the Sick-travel model (bottom). Each value is averaged over 1000 stochastic simulations assuming R = 30, Pw = 0.06, PT = 4e-04. Each hotspot was located randomly in the population, and disease was introduced into the group ranging in the middle of the habitat.

References

    1. Real LA, Biek R. Spatial dynamics and genetics of infectious diseases on heterogeneous landscapes. J R Soc Interface. 2007;4:935–948. - PMC - PubMed
    1. Plowright RK, Sokolow SH, Gorman ME, Daszak P, Foley JE. Causal inference in disease ecology: investigating ecological drivers of disease emergence. Front Ecol Environ. 2008;6:420–429.
    1. Ostfeld RS, Glass GE, Keesing F. Spatial epidemiology: an emerging (or re-emerging) discipline. Trends Ecol Evol. 2005;20:328–336. - PubMed
    1. Small M, Tse CK, Walker DM. Super-spreaders and the rate of transmission of the SARS virus. Phys D. 2006;215:146–158. - PMC - PubMed
    1. Paunio M, Peltola H, Valle M, Davidkin I, Virtanen M, et al. Explosive school-based measles outbreak - Intense exposure may have resulted in high risk, even among revaccinees. Am J Epidemiol. 1998;148:1103–1110. - PubMed

Publication types