. 2012;7(2):e31415.
doi: 10.1371/journal.pone.0031415. Epub 2012 Feb 21.

Propagation of epileptiform events across the corpus callosum in a cingulate cortical slice preparation

Affiliations

Propagation of epileptiform events across the corpus callosum in a cingulate cortical slice preparation

Jeffrey Walker et al. PLoS One. 2012.

Abstract

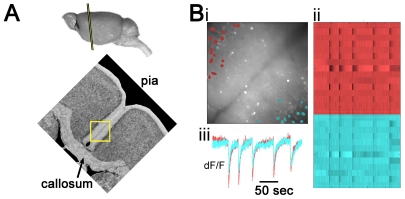
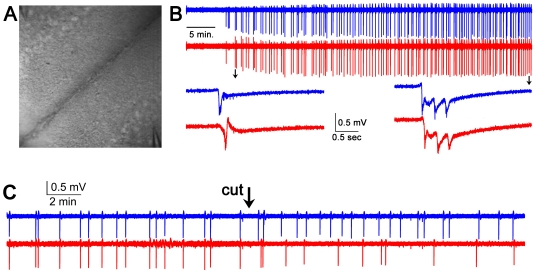
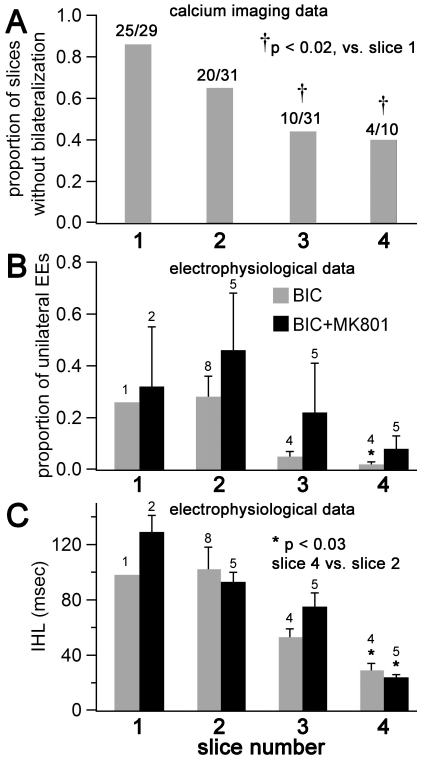
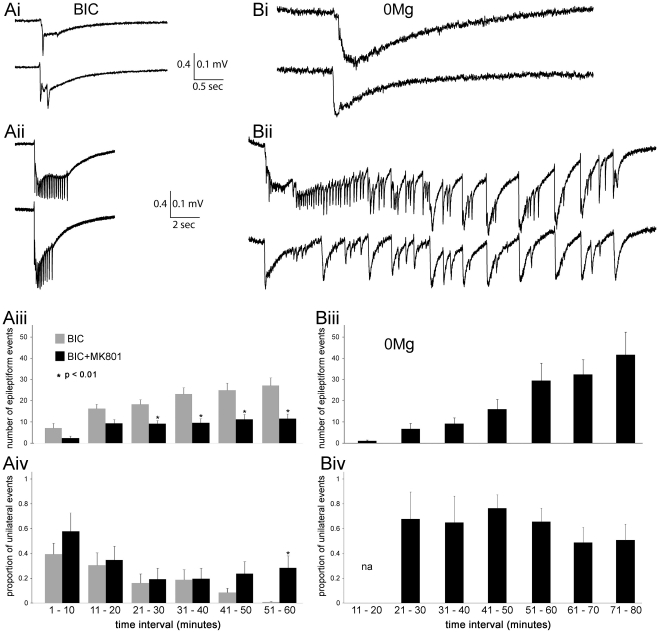
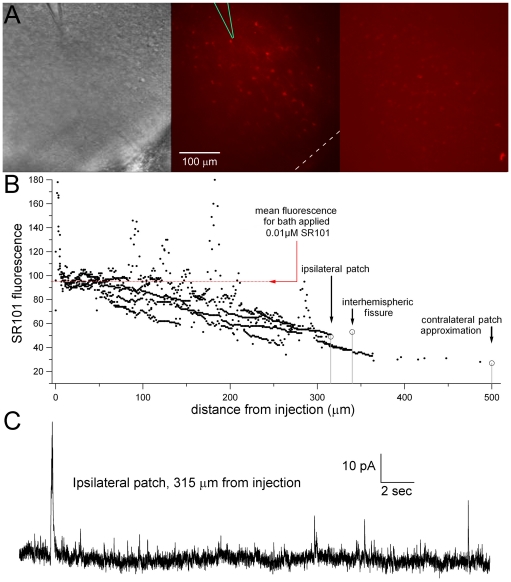
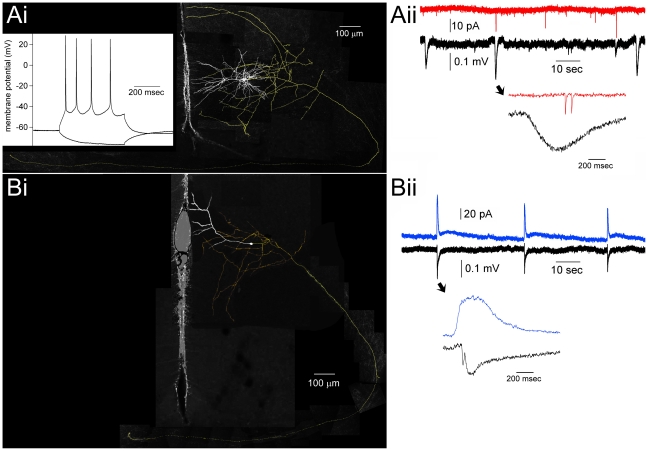
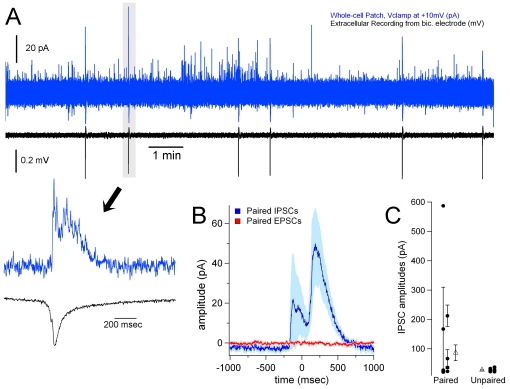
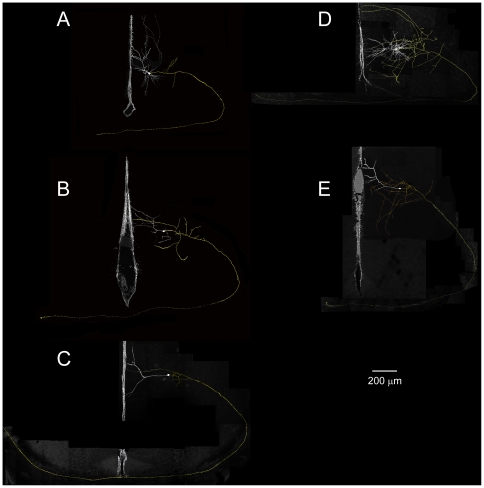
We report on a novel mouse in vitro brain slice preparation that contains intact callosal axons connecting anterior cingulate cortices (ACC). Callosal connections are demonstrated by the ability to regularly record epileptiform events between hemispheres (bilateral events). That the correlation of these events depends on the callosum is demonstrated by the bisection of the callosum in vitro. Epileptiform events are evoked with four different methods: (1) bath application of bicuculline (a GABA-A antagonist); (2) bicuculline+MK801 (an NMDA receptor antagonist), (3) a zero magnesium extracellular solution (0Mg); (4) focal application of bicuculline to a single cortical hemisphere. Significant increases in the number of epileptiform events, as well as increases in the ratio of bilateral events to unilateral events, are observed during bath applications of bicuculline, but not during applications of bicuculline+MK-801. Long ictal-like events (defined as events >20 seconds) are only observed in 0Mg. Whole cell patch clamp recordings of single neurons reveal strong feedforward inhibition during focal epileptiform events in the contralateral hemisphere. Within the ACC, we find differences between the rostral areas of ACC vs. caudal ACC in terms of connectivity between hemispheres, with the caudal regions demonstrating shorter interhemispheric latencies. The morphologies of many patch clamped neurons show callosally-spanning axons, again demonstrating intact callosal circuits in this in vitro preparation.


Conflict of interest statement

Competing Interests: The authors have declared that no competing interests exist.

Figures

Figure 1
Figure 1. A mouse in vitro slice preparation demonstrates bilateral epileptiform events (EEs).
(A) Top, a mouse brain in profile is shown with a line demarcating the slice angle and approximate rostral-caudal coordinate. Bottom, the callosal slice preparation is oriented with respect to the camera view so that layer 2/3 of cingulate cortices can be seen in the upper left and bottom right corners, respectively. The camera view is represented by the yellow rectangle, 410 µm wide. These pictures are adapted from the Mouse Brain Library, mbl.org (Bi) Bathed in 20 µM bicuculline, EEs are recorded using fura-2am calcium imaging, as viewed through a 410 µm×410 µm mean fluorescent image of the slice. The interhemispheric fissure runs from the bottom left to top right hand corner of the image, and active neurons are identified in red (left hemisphere) and blue (right hemisphere). (Bii) The calcium transients of neurons identified in Bi are displayed as raster plots. Each line represents one cell, and each color represents one hemisphere. Darker transients indicate increased calcium influx, thus, high action potential activity. (Biii) The mean fluorescent transients from each hemisphere of identified cells show bilateral EEs across the hemispheres.
Figure 2
Figure 2. Electrophysiological extracellular recordings of bilateral EEs.
(A) 410 µm×410 µm DIC view of the slice, showing the location of two extracellular recording electrodes in each hemisphere (upper left and lower right corners). The interhemispheric fissure forms the rightward slanting diagonal that roughly bisects the image. (B) Two simultaneous extracellular recordings, one hour long, and each from opposite hemispheres in layer 2/3 cingulate cortices show bilateral EEs. 20 µM bicuculline is added to the bath perfusion at the beginning of the recording. These recordings were highpass filtered at 0.2 Hz. Individual bilateral events indicated by arrows are temporally magnified below and are shown without highpass filtering. Sample rate = 5 kHz. Note that the number of events increases per unit time, and the number of afterdischarges per event increases. (C) Complete bisection of the corpus callosum in vitro abolishes bilateral temporal fidelity of EEs (15/15 bilateral events before the cut during 15 minutes of recording, 0/20 bilateral events after the cut during 15 minutes of recording, both with reference to the “blue” recording, p<0.01, Chi Square test of proportions). During a dual extracellular recording in 20 µM bicuculline, a small blade over the corpus callosum is lowered with a micromanipulator, severing all callosal connections during the recording.
Figure 3
Figure 3. Differences in bilateral epileptiform activity according to rostral-caudal coordinates of the slice within ACC.
Recordings are grouped according to slice number, where each slice increment represents a 350 µm increment caudally from the most rostral part of the corpus callosum, and slice 1 is the first slice to show an intact callosum as slices are taken from rostral to caudal. (A) Calcium imaging data from a total of 101 slices, each recorded for approximately 2 minutes. Proportions of slices that yielded no evidence of bilateralization are shown (i.e., no cells recorded in separate hemispheres with simultaneous calcium transients). The caudal slices were more likely to demonstrate bilateral EEs. (B) and (C) Data from 30–60 minute-long long extracellular electrophysiological recordings. For the BIC group (20 µM bicuculline), n = 1, 8, 4, and 4 for slices 1–4, respectively, while for the BIC+MK801 group (20 µM bicuculline+10 µM MK-801), n = 2, 5, 5, and 5 for slices 1–4, respectively. (B) The proportion of unilateral EEs in each recording is smaller for caudal slices than rostral slices within ACC. For the BIC group, there is a significant difference in these values between the slice 4 and slice 2 groups. Note a similar trend in the BIC+MK801 group. (C) The interhemispheric latencies (IHLs) are shorter for caudal slices than in rostral slices, for both the BIC and BIC+MK801 groups.
Figure 4
Figure 4. Comparisons of different seizure models in the callosal slice preparation using dual recordings in two hemispheres simultaneously.
Representative examples of bilateral EEs recorded in BIC (Ai and Aii) versus 0Mg (Bi and Bii) are shown. In each bilateral EE example, there are two simultaneous recordings, where each recording is gathered from opposite hemispheres in a single slice preparation. Ai and Bi show events that resemble inter-ictal events (5 sec. or less). These were the predominant kind of events recorded overall, and the only kind of event recorded in the BIC recordings. Aii and Bii show the longest event recorded for BIC (approx. 5 sec.), and a typical ictal-like event for 0Mg (approx. 30 sec.), respectively (note differerent time scales in the i vs. ii panels). For all panels, 0.4 mV is the y-scale for BIC, while 0.1 mV represents the y-scale for 0Mg, reflecting the significantly larger amplitudes found for these EEs in BIC. (Aiii) Significant differences in the number of EEs arise between the BIC and BIC+MK801 groups during the course of recordings (Wilcoxon rank sum test). (Aiv) The proportion of EEs that are unilateral decreases more in the BIC group than in the BIC+MK801 group (Chi square test of proportions). Data from both (Aiii) and (Aiv) show mean ± SE. n = 17 paired recordings from 17 slices from 9 mice in the BIC group, while n = 17 paired recordings from 17 slices from 5 mice in the BIC+MK801 group. (Biii) The number of EEs increase during long recordings in 0Mg. Data shown are only from slices that demonstrated any EEs during recordings (n = 27 from a total of 46 slices). (Biv) In contrast to BIC data, there is not a significant decrease in the proportion of unilateral events during long recordings. Data shown are only from slices that demonstrated at least one bilateral EE (n = 13 slices).
Figure 5
Figure 5. Microinjection solution (200 µM bicuculline+10 µM SR101) concentration decreases with distance and does not directly affect contralateral cortex.
(A) Representative IR-DIC (left) and SR101 fluorescence (middle) images of a single microinjection from the injection pipette (bic. electrode). The bic. electrode (green) and the interhemispheric fissure (white dashed line) are highlighted in the SR101 image (middle panel). Note the disappearance of visible SR101 fluorescence in the vicinity of the interhemispheric fissure. A slice that was bathed in 0.01 µM SR101 for 30 minutes, followed by a 15 minute wash, is displayed as a reference (right panel). (B) SR101 fluorescence is reduced over 1000-fold from the 10 µM SR101 in the bic. electrode solution. Each black dot represents the grayscale brightness of one measured sample pixel at various distances from the tip of the injection (n = 1137). Dashed red line indicates the mean grayscale brightness from the 0.01 µM SR101 application displayed in A (mean pixel brightness = 94.5, standard deviation = 6.9), suggesting that the bic. injection falls to a 1000-fold dilution at approximately 300 µm distance from the tip of the bic. electrode. The “ipsilateral patch” represents an ipsilateral layer 2/3 neuron from which IPSCs were recorded during the injection. (C) Whole-cell patch clamp recordings ipsilateral to a bic. microinjection reveal spontaneous IPSCs. This neuron, located 315 µm away from the tip of the injection pipette, was voltage clamped at +10 mV using cesium gluconate to isolate GABA-A IPSCs. The presence of these IPSCs indicates that the concentration of bicuculline from the injection pipette at this distance did not sufficiently promote GABA-A antagonism.
Figure 6
Figure 6. Simultaneous recording of bicuculline EEs in one hemisphere and PSCs in contralateral hemisphere in single neurons.
(Ai) The morphology of a pyramidal neuron in layer 2/3 with a callosal-spanning axon. Inset: response of this neuron to −30 pA and +80 pA current injections, the latter resulting in action potentials. (Aii) The same neuron displayed in Ai is recorded at −70 mV in voltage clamp for 30 minutes while bicuculline is injected into the contralateral hemisphere with a bic. electrode. Black traces are extracellular recordings from the bic. electrode, and the red trace shows EPSCs (as downward deflections) from the neuron. A temporally magnified view of a putative EE-correlated pair of EPSCs is shown, as indicated by the arrow. (Bi) The morphology of a pyramidal neuron in layer 2/3 with a callosally-spanning axon. This neuron was recorded with cesium gluconate in order to better isolate GABA-A IPSCs, and so action potential characterization was not possible in this configuration due to cesium blockade of potassium conductances. (Bii) The same neuron displayed in Bi is recorded at +10 mV in voltage clamp for 30 minutes while bicuculline is injected into the contralateral hemisphere. Black traces are EEs recorded in the bic. electrode, and the blue trace shows IPSCs. Note the long durations of the IPSCs that correlate with the EEs. Temporally magnified views of putative EE-correlated IPSCs are shown, as indicated by arrows.
Figure 7
Figure 7. Injection of bicuculline in one hemisphere results in bursts of IPSCs in the contralateral hemisphere.
(A) Fifteen minutes of a representative recording of IPSCs (blue trace) and EEs (black trace) are shown (same format as Fig. 6Bii, although this is from a different recording). A temporally magnified view is shown of a single EE-IPSC pair, as indicated by the highlighted region and arrow. Note the long duration of the IPSC (>200 msec) and significantly large amplitude of this event (largest in the entire recording), indicating that the event probably results from a burst of IPSCs. (B) EE-triggered averages of voltage clamp recordings. Time 0 represents the time of onset of a contralateral EE. Only recordings where putative correlated PSCs were found were included in the averaging. Number of extracted windows averaged: IPSCs, n = 26 from 8 slices; EPSCs, n = 30 from 3 slices. The shading represents the ± SE. (C) The mean ± SE for IPSC amplitudes are shown from each neuron as dots, and they are separated into two groups: IPSCs that were paired with a contralateral EE, and IPSCs that were not paired with a contralateral EE. The triangles represent the mean of means for each group, showing a significant difference in the amplitudes of paired vs. unpaired IPSCs (p<0.01 rank sum test).
Figure 8
Figure 8. Morphologies of neurons with axons spanning the callosum (axons colored yellow, while somata and dendrites colored white).
Each panel displays the interhemispheric fissure as a reference, and each panel is oriented with the corpus callosum on the bottom, and neuron on the right. A , B, and E show neurons with asymmetrical apical dendrites that are skewed in a direction away from the callosum. Blebs indicating cut axons were seen in A, B, and D at the end of each respective axon, while the axon appeared to fade from view in C and E. Neurons in panels D and E are also shown in Fig. 6. The average length of these imaged axons, from cell body to ending in contralateral hemisphere, is 2443±314 µm.

Similar articles

Cited by

References

    1. Spencer SS. Corpus callosum section and other disconnection procedures for medically intractable epilepsy. Epilepsia. 1988;29(Suppl 2):S85–S99. - PubMed
    1. Spencer SS, Spencer DD, Sass K, Westerveld M, Katz A, et al. Anterior, total, and two-stage corpus callosum section: differential and incremental seizure responses. Epilepsia. 1993;34:561–567. - PubMed
    1. sadi-Pooya AA, Sharan A, Nei M, Sperling MR. Corpus callosotomy. Epilepsy Behav. 2008;13:271–278. - PubMed
    1. Marcus EM, Watson CW. Symmetrical epileptogenic foci in monkey cerebral cortex. Mechanisms of interaction and regional variations in capacity for synchronous discharges. Arch Neurol. 1968;19:99–116. - PubMed
    1. Erickson TC. Spread of the epileptic discharge - An experimental study of the after-discharge induced by electrical stimulation of the cerebral cortex. Archives of Neurology and Psychiatry. 1940;43:429–452.

Publication types

MeSH terms