. 2012;7(2):e31574.
doi: 10.1371/journal.pone.0031574. Epub 2012 Feb 21.

Anti-inflammatory role of the cAMP effectors Epac and PKA: implications in chronic obstructive pulmonary disease

Affiliations

Anti-inflammatory role of the cAMP effectors Epac and PKA: implications in chronic obstructive pulmonary disease

Anouk Oldenburger et al. PLoS One. 2012.

Abstract

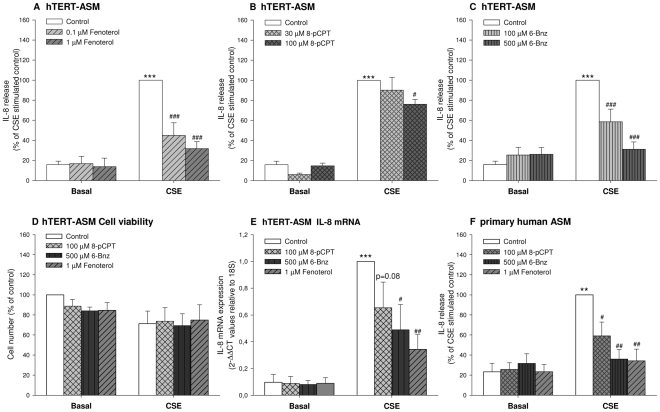
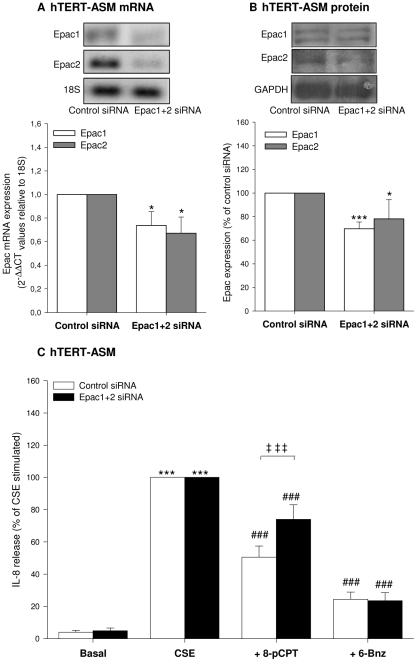
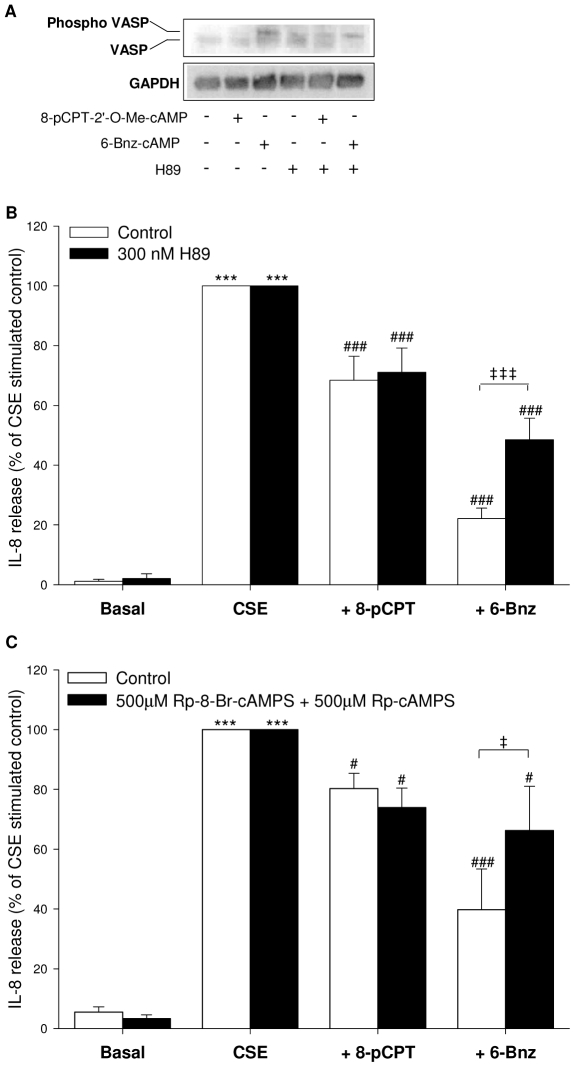
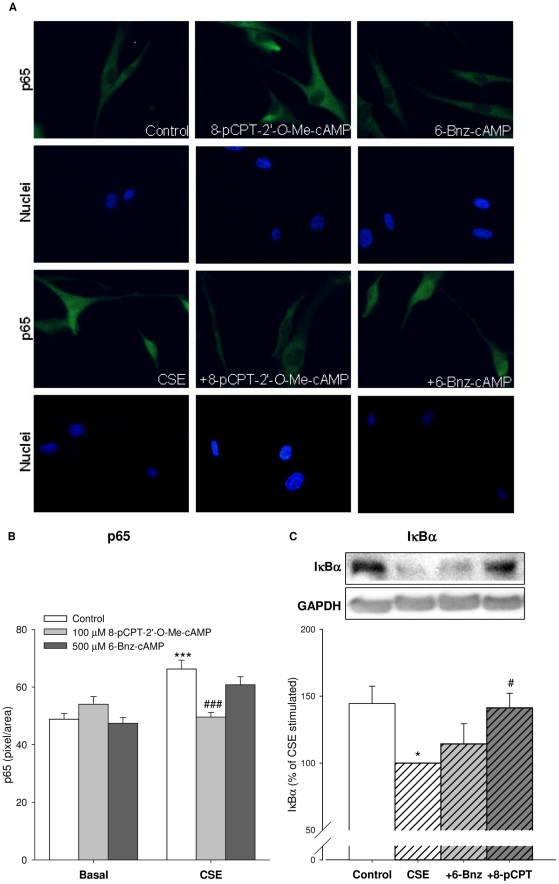
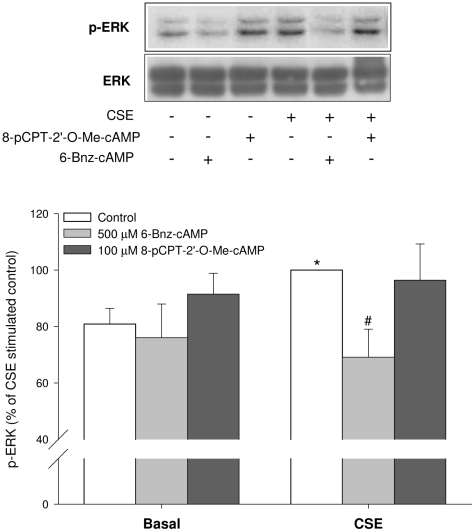
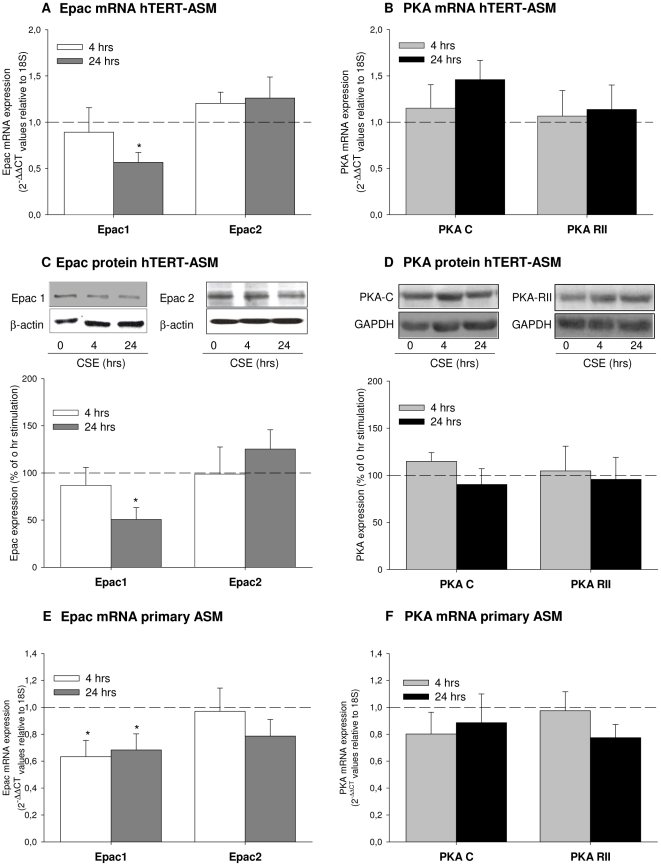
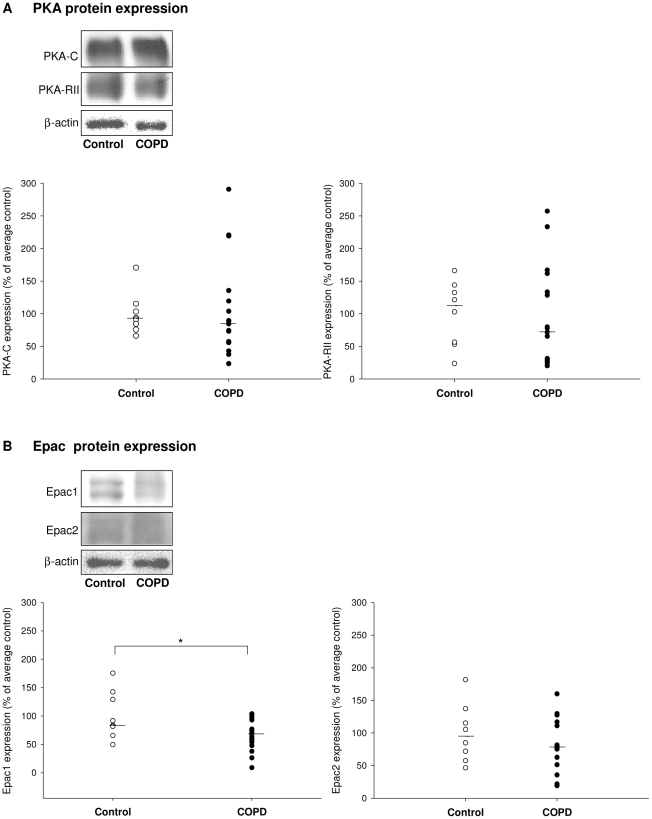
Cigarette smoke-induced release of pro-inflammatory cytokines including interleukin-8 (IL-8) from inflammatory as well as structural cells in the airways, including airway smooth muscle (ASM) cells, may contribute to the development of chronic obstructive pulmonary disease (COPD). Despite the wide use of pharmacological treatment aimed at increasing intracellular levels of the endogenous suppressor cyclic AMP (cAMP), little is known about its exact mechanism of action. We report here that next to the β(2)-agonist fenoterol, direct and specific activation of either exchange protein directly activated by cAMP (Epac) or protein kinase A (PKA) reduced cigarette smoke extract (CSE)-induced IL-8 mRNA expression and protein release by human ASM cells. CSE-induced IκBα-degradation and p65 nuclear translocation, processes that were primarily reversed by Epac activation. Further, CSE increased extracellular signal-regulated kinase (ERK) phosphorylation, which was selectively reduced by PKA activation. CSE decreased Epac1 expression, but did not affect Epac2 and PKA expression. Importantly, Epac1 expression was also reduced in lung tissue from COPD patients. In conclusion, Epac and PKA decrease CSE-induced IL-8 release by human ASM cells via inhibition of NF-κB and ERK, respectively, pointing at these cAMP effectors as potential targets for anti-inflammatory therapy in COPD. However, cigarette smoke exposure may reduce anti-inflammatory effects of cAMP elevating agents via down-regulation of Epac1.


Conflict of interest statement

Competing Interests: The authors have declared that no competing interests exist.

Figures

Figure 1
Figure 1. Fenoterol, 6-Bnz-cAMP and 8-pPCT-2′-O-Me-cAMP reduce CSE-induced IL-8 release from human ASM cells.
hTERT ASM cells (A, B and C) and human primary ASM cells (F) were stimulated with 15% CSE in the absence or presence of fenoterol (0.1 or 1 µM), 6-Bnz-cAMP (100 µM or 500 µM) or 8-pCPT-2′-O-Me-cAMP (30 or 100 µM) for 24 hrs. Basal IL-8 release was 109,4±33,2 pg/ml in hTERT ASM cells and 7,5±4,7 in primary human ASM cells. Cells stimulated with 15% CSE for 6 hrs showed an increase in IL-8 mRNA expression which was reduced by fenoterol (1 µM), 6-Bnz-cAMP (500 µM) or 8-pCPT-2′-O-Me-cAMP (100 µM) (E). CSE, Fenoterol, 6-Bnz-cAMP and 8-pPCT-2′-O-Me-cAMP did not affect cell viability (D). Results are represented as means ± SEM of 6–22 separate experiments. Statistical analysis was performed by one-way ANOVA followed by a Newman-Keuls post-hoc test. *** P<0.001, ** P<0.01 compared to basal control; # P<0.05, ## P<0.01. ### P<0.001 compared to CSE-stimulated control.
Figure 2
Figure 2. Epac knock-down attenuates the inhibitory effect of 8-pCPT-2′-O-Me-cAMP on CSE-induced IL-8 release.
Epac1 and Epac2 mRNA and protein levels were analyzed after co-transfection with Epac1 and Epac2 siRNA or after transfection with control siRNA, resulting in a significant downregulation of both Epac1 and 2 mRNA (A) and protein (B) compared to control siRNA. Transfected hTERT-ASM cells were stimulated without (basal) or with 15% CSE in the absence or presence of either 500 µM 6-Bnz-cAMP or 100 µM 8-pCPT-2′-O-Me-cAMP for 24 hrs (C). Data are presented as means±SEM of 4–8 separate experiments. Statistical analysis was performed by one-way ANOVA followed by a Dunnett post-hoc test. *P<0.05, *** P<0.001 compared to basal. # P<0.05; ### P<0.001 compared to CSE. ‡‡ P<0.01, ‡‡‡ P<0.001.
Figure 3
Figure 3. Inhibition of PKA attenuates the effect of 6-Bnz-cAMP on CSE-induced IL-8 release.
Phosphorylation of VASP in hTERT-ASM cells treated with 100 µM 8-pCPT-2′-O-Me-cAMP or 500 µM 6-Bnz-cAMP in the absence or presence of the PKA inhibitor H89 (300 nM) was analysed by using an antibody, which recognizes both the phosphorylated VASP (phospho-VASP) and the non phosphorylated VASP (VASP) (A). VASP was normalized to GAPDH. Representative immunoblots of 3 experiments are shown. hTERT-ASM were pre-treated without (white bars) or with (black bars) 300 nM H89 (B) or 500 µM of both Rp-8-Br-cAMPS and Rp-cAMPS (C) for 30 min before stimulation with 15% CSE, 100 µM 8-pCPT-2′-O-Me-cAMP, 500 µM 6-Bnz-cAMP or their combinations. Data are presented as means±SEM of 3–9 separate experiments. Statistical analysis was performed by one-way ANOVA followed by a Newman-Keuls post-hoc test. *** P<0.001 compared to basal control. # P<0.05, ### P<0.001 compared to CSE. P<0.05, ‡‡‡ P<0.001.
Figure 4
Figure 4. 8-pCPT-2′-O-Me-cAMP prevents CSE-induced breakdown of IκBα and p65 nuclear translocation.
p65 nuclear translocation was determined by immunofluorescence using p65 antibodies on hTERT-ASM cells stimulated without (control) or with 15% CSE for 2 hrs, alone or in combination with 100 µM 8-pCPT-2′-O-Me-cAMP or 500 µM 6-Bnz-cAMP. Representative results of 3 separate experiments are shown (A) with the quantification of p65 nuclear staining (B). hTERT-ASM cells were treated with 15% CSE, 100 µM 8-pCPT-2′-O-Me-cAMP, 500 µM 6-Bnz-cAMP or their combinations for 1 hr. Cells were lysed and IκBα levels were determined by Western blot analysis (C). Bands were normalized to GAPDH. Representative immunoblots of IκBα and GAPDH are shown. Data are presented as means±SEM of 6–7 separate experiments. Statistical analysis was performed by one-way ANOVA followed by a Dunnett post-hoc test. * P<0.05, *** P<0.001 compared to basal control. # P<0.05, ### P<0.001 compared to CSE.
Figure 5
Figure 5. 6-Bnz-cAMP prevents CSE-induced ERK phosphorylation.
hTERT-ASM cells were lysed after being stimulated with 15% CSE, 100 µM 8-pCPT-2′-O-Me-cAMP, 500 µM 6-Bnz-cAMP or their combinations for 1 hr followed by Western blot analysis of phospho-ERK (p-ERK). Total ERK (ERK) was used as a loading control. Representative immunoblots of p-ERK and ERK are shown. Data are presented as means±SEM of 7–8 separate experiments. Statistical analysis was performed by one-way ANOVA followed by a Dunnett post-hoc test. * P<0.05 compared to basal control. # P<0.05 compared to CSE.
Figure 6
Figure 6. Epac1 is down-regulated by CSE.
hTERT-ASM or primary ASM cells were treated for 4 and 24 hrs with 15% CSE. Then, cells were lysed for protein and mRNA determination. mRNA (A) and protein expression (C) of Epac1 was significant down regulated after exposure to CSE, while Epac2 was unaffected in hTERT cells. Same results were obtained in primary cells (E) Catalytic (PKA-C) and regulatory type II (PKA-RII) subunits of PKA mRNA (B & F) and protein (D) expression were not affected by CSE exposure in hTERT cells and in primary ASM cells. Protein expression of Epac1 and Epac2 (C) and PKA-C PKA-RII (D) were normalized to β-actin (for Epac) and GAPDH (for PKA). mRNA expression was normalized to 18 S. Data represent mean±SEM of 3–5 independent experiments. Statistical analysis was performed by one-way ANOVA followed by a Newman-Keuls post-hoc test. * P<0.05 compared to time point 0 hrs.
Figure 7
Figure 7. Epac and PKA expression in COPD patients.
Expression of PKA-C and PKA-RII (A) and Epac1 and Epac2 (B) was evaluated by immunoblotting. Equal protein loading was verified by the analysis of β-actin. Responses were quantified by densitometry and normalized to the expression of β-actin. Data are derived from 9 controls and 15–19 COPD patients. Median of each group is indicated by -----. *P<0.05. Statistical differences between control and COPD were determined by non-parametric Mann-Whitney test.

References

    1. Hogg JC, Timens W. The pathology of chronic obstructive pulmonary disease. Annu Rev Pathol. 2009;4:435–459. - PubMed
    1. Quint JK, Wedzicha JA. The neutrophil in chronic obstructive pulmonary disease. J Allergy Clin Immunol. 2007;119:1065–1071. - PubMed
    1. Shapiro SD, Goldstein NM, Houghton AM, Kobayashi DK, Kelley D, et al. Neutrophil elastase contributes to cigarette smoke-induced emphysema in mice. Am J Pathol. 2003;163:2329–2335. - PMC - PubMed
    1. Stanescu D, Sanna A, Veriter C, Kostianev S, Calcagni PG, et al. Airways obstruction, chronic expectoration, and rapid decline of FEV1 in smokers are associated with increased levels of sputum neutrophils. Thorax. 1996;51:267–271. - PMC - PubMed
    1. Hurst JR, Perera WR, Wilkinson TM, Donaldson GC, Wedzicha JA. Systemic and upper and lower airway inflammation at exacerbation of chronic obstructive pulmonary disease. Am J Respir Crit Care Med. 2006;173:71–78. - PubMed

Publication types

MeSH terms