. 2012;7(2):e31800.
doi: 10.1371/journal.pone.0031800. Epub 2012 Feb 21.

Health system resource gaps and associated mortality from pandemic influenza across six Asian territories

Collaborators, Affiliations

Health system resource gaps and associated mortality from pandemic influenza across six Asian territories

James W Rudge et al. PLoS One. 2012.

Abstract

Background: Southeast Asia has been the focus of considerable investment in pandemic influenza preparedness. Given the wide variation in socio-economic conditions, health system capacity across the region is likely to impact to varying degrees on pandemic mitigation operations. We aimed to estimate and compare the resource gaps, and potential mortalities associated with those gaps, for responding to pandemic influenza within and between six territories in Asia.

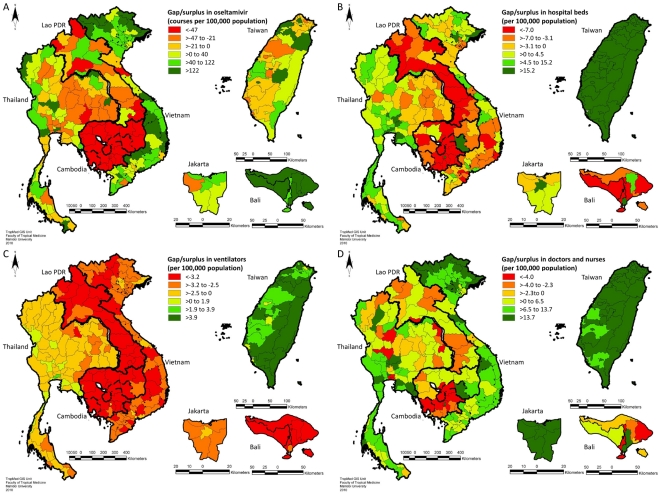
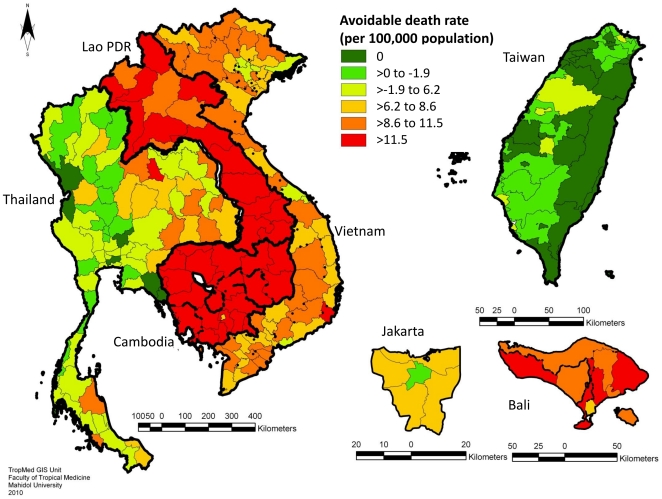
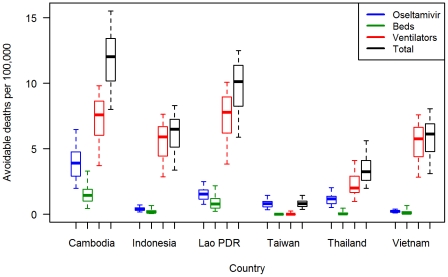
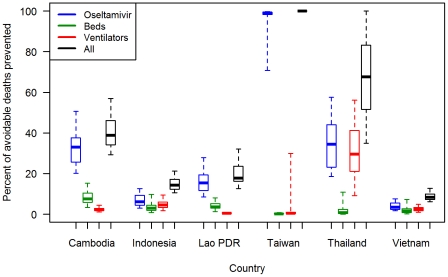
Methods and findings: We collected health system resource data from Cambodia, Indonesia (Jakarta and Bali), Lao PDR, Taiwan, Thailand and Vietnam. We applied a mathematical transmission model to simulate a "mild-to-moderate" pandemic influenza scenario to estimate resource needs, gaps, and attributable mortalities at province level within each territory. The results show that wide variations exist in resource capacities between and within the six territories, with substantial mortalities predicted as a result of resource gaps (referred to here as "avoidable" mortalities), particularly in poorer areas. Severe nationwide shortages of mechanical ventilators were estimated to be a major cause of avoidable mortalities in all territories except Taiwan. Other resources (oseltamivir, hospital beds and human resources) are inequitably distributed within countries. Estimates of resource gaps and avoidable mortalities were highly sensitive to model parameters defining the transmissibility and clinical severity of the pandemic scenario. However, geographic patterns observed within and across territories remained similar for the range of parameter values explored.

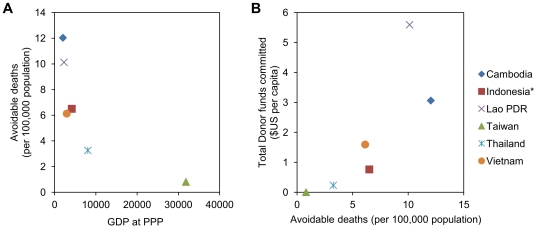
Conclusions: The findings have important implications for where (both geographically and in terms of which resource types) investment is most needed, and the potential impact of resource mobilization for mitigating the disease burden of an influenza pandemic. Effective mobilization of resources across administrative boundaries could go some way towards minimizing avoidable deaths.


Conflict of interest statement

Competing Interests: The authors have declared that no competing interests exist.

Figures

Figure 1
Figure 1. Geographical distribution of estimated health system resource gaps for a modeled pandemic influenza scenario.
Gaps are mapped for oseltamivir (A), hospital beds (B), mechanical ventilators (C), and healthcare workers (pooled number of doctors and nurses; D). Areas shaded according to values ≤0 represent areas where a resource gap is predicted. Gaps are standardized by population size and mapped at province level for Cambodia, Lao PDR, Thailand, and Vietnam, at county level for Taiwan, and at district level for Jakarta and Bali in Indonesia.
Figure 2
Figure 2. Geographical distribution of estimated avoidable mortality rates due to resource gaps for a modeled pandemic influenza scenario.
Values are mapped at province level for Cambodia, Lao PDR, Thailand and Vietnam, at county level for Taiwan, and at district level for Jakarta and Bali in Indonesia.
Figure 3
Figure 3. Estimated avoidable mortality rates due to each resource gap across countries for a modeled pandemic influenza scenario.
Deaths attributed to shortages of oseltamivir, hospital beds, and ventilators are estimated from the number of deaths that the model predicts would be prevented by filling the gap in each of these resources alone. Boxplots show medians, interquartile ranges, and 95th percentile ranges derived from a multivariate uncertainty analysis. Data are aggregated across provinces for Cambodia, Lao PDR, Thailand, Vietnam, and across counties for Taiwan. Data for Indonesia are aggregated across districts of Jakarta and Bali only.
Figure 4
Figure 4. Association of predicted avoidable mortality rates with gross domestic product (A) and donor funding (B).
Data on gross domestic product at product purchasing power (GDP at PPP) for 2009, obtained from the World Economic Outlook Database-April 2010, International Monetary Fund (http://www.imf.org/, accessed April 21st 2010). Donor funds represent the total committed towards avian and human influenza up to December 2009, as reported in International Financial and Technical Assistance report for the International Ministerial Conference on Animal and Pandemic Influenza-2010, Hanoi, Vietnam (http://www.imcapi-hanoi-2010.org/documents/en/, accessed June 18th 2010). *Avoidable mortality rates for Indonesia are estimated from Jakarta and Bali only.
Figure 5
Figure 5. Estimated impact of resource mobilization/redistribution across provinces on avoidable mortality rates within each territory.
Data were calculated by estimating the number of avoidable deaths if available resources (including central stockpiles for oseltamivir) within each territory were geographically distributed in proportion to provincial population size, and comparing with the total number of avoidable deaths predicted given actual resource distribution. Boxplots show medians, interquartile ranges, and 95th percentile ranges derived from a multivariate uncertainty analysis. Data are aggregated across provinces for Cambodia, Lao PDR, Thailand, Vietnam, and across counties for Taiwan. Data for Indonesia are aggregated across districts of Jakarta and Bali only.

References

    1. Ercole A, Taylor BL, Rhodes A, Menon DK. Modelling the impact of an influenza A/H1N1 pandemic on critical care demand from early pathogenicity data: the case for sentinel reporting. Anaesthesia. 2009;64:937–941. - PubMed
    1. Corley A, Hammond NE, Fraser JF. The experiences of health care workers employed in an Australian intensive care unit during the H1N1 Influenza pandemic of 2009: a phenomenological study. Int J Nurs Stud. 2010;47:577–585. - PMC - PubMed
    1. Takeuchi S, Kuroda Y. [Predicting spread of new pandemic swine-origin influenza A (H1N1) in local mid-size city: evaluation of hospital bed shortage and effectiveness of vaccination]. Nippon Eiseigaku Zasshi. 2010;65:48–52. - PubMed
    1. Anderson TA, Hart GK, Kainer MA. Pandemic influenza-implications for critical care resources in Australia and New Zealand. J Crit Care. 2003;18:173–180. - PubMed
    1. Balcan D, Colizza V, Singer AC, Chouaid C, Hu H, et al. Modeling the critical care demand and antibiotics resources needed during the Fall 2009 wave of influenza A(H1N1) pandemic. PLoS Curr Influenza. 2009:RRN1133. - PMC - PubMed

Publication types

MeSH terms