. 2012;7(2):e31812.
doi: 10.1371/journal.pone.0031812. Epub 2012 Feb 21.

Liver-specific expression of transcriptionally active SREBP-1c is associated with fatty liver and increased visceral fat mass

Affiliations

Liver-specific expression of transcriptionally active SREBP-1c is associated with fatty liver and increased visceral fat mass

Birgit Knebel et al. PLoS One. 2012.

Abstract

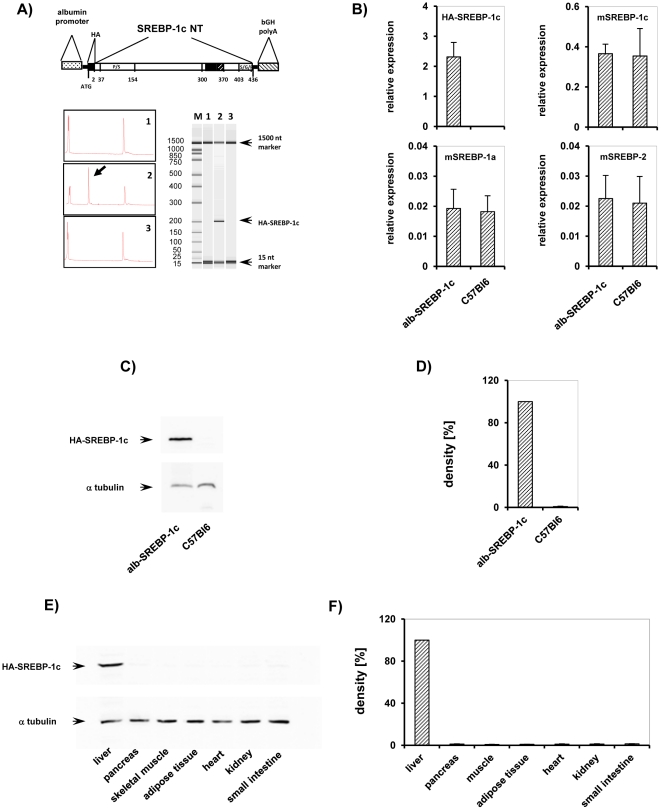
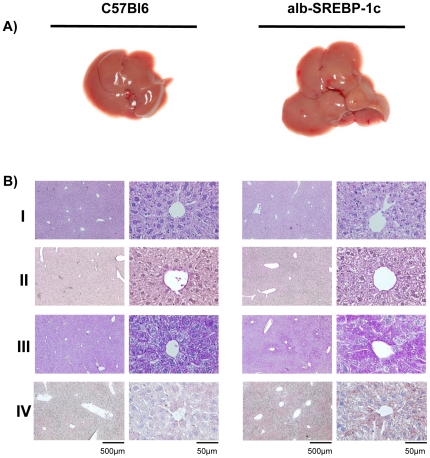
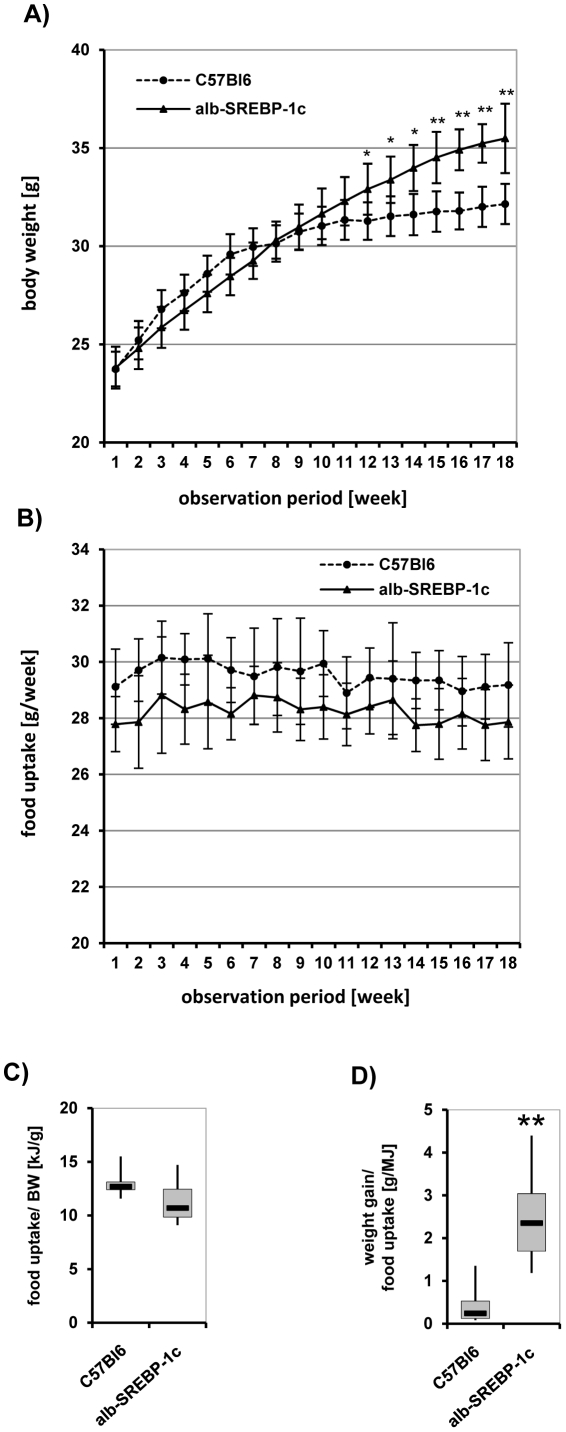
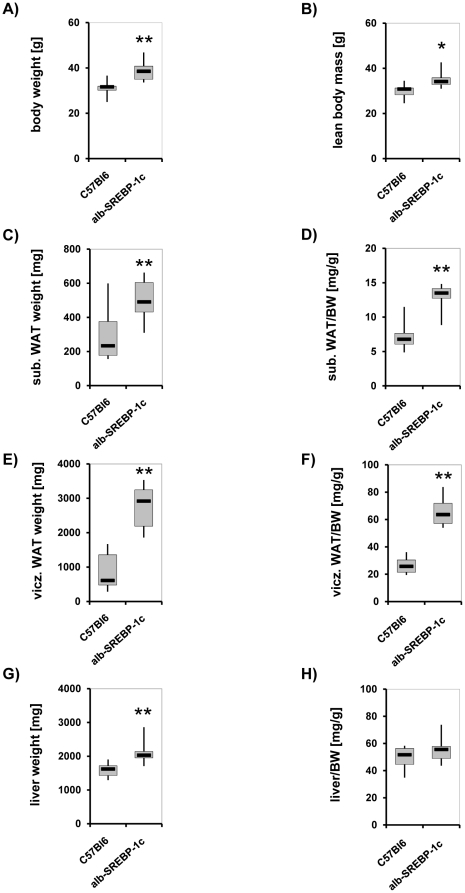
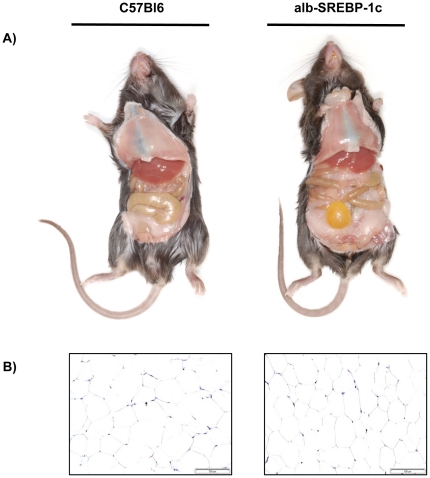
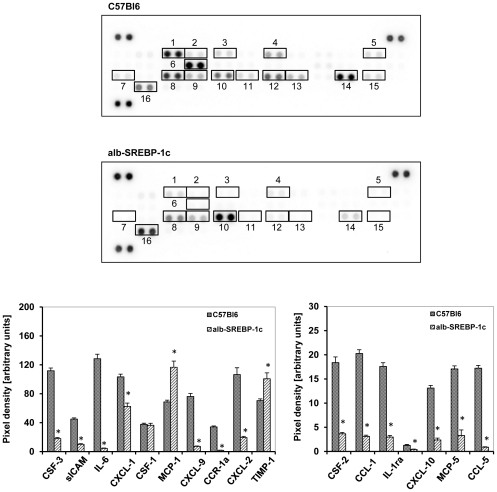
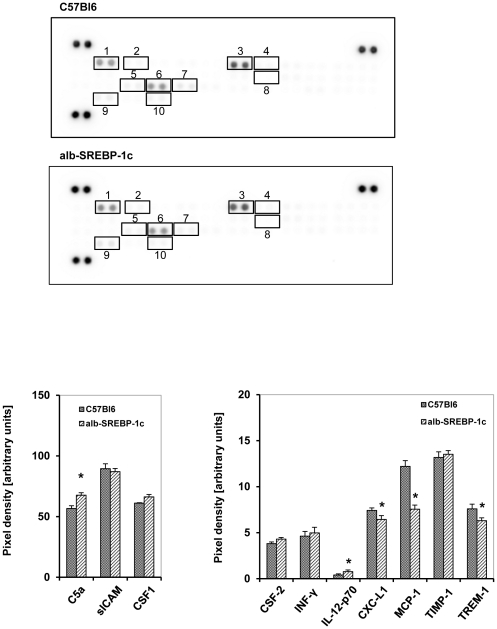
The pathogenesis of fatty liver is not understood in detail, but lipid overflow as well as de novo lipogenesis (DNL) seem to be the key points of hepatocyte accumulation of lipids. One key transcription factor in DNL is sterol regulatory element-binding protein (SREBP)-1c. We generated mice with liver-specific over-expression of mature human SREBP-1c under control of the albumin promoter and a liver-specific enhancer (alb-SREBP-1c) to analyze systemic perturbations caused by this distinct alteration. SREBP-1c targets specific genes and causes key enzymes in DNL and lipid metabolism to be up-regulated. The alb-SREBP-1c mice developed hepatic lipid accumulation featuring a fatty liver by the age of 24 weeks under normocaloric nutrition. On a molecular level, clinical parameters and lipid-profiles varied according to the fatty liver phenotype. The desaturation index was increased compared to wild type mice. In liver, fatty acids (FA) were increased by 50% (p<0.01) and lipid composition was shifted to mono unsaturated FA, whereas lipid profile in adipose tissue or serum was not altered. Serum analyses revealed a ∼2-fold (p<0.01) increase in triglycerides and free fatty acids, and a ∼3-fold (p<0.01) increase in insulin levels, indicating insulin resistance; however, no significant cytokine profile alterations have been determined. Interestingly and unexpectedly, mice also developed adipositas with considerably increased visceral adipose tissue, although calorie intake was not different compared to control mice. In conclusion, the alb-SREBP-1c mouse model allowed the elucidation of the systemic impact of SREBP-1c as a central regulator of lipid metabolism in vivo and also demonstrated that the liver is a more active player in metabolic diseases such as visceral obesity and insulin resistance.


Conflict of interest statement

Competing Interests: The authors have declared that no competing interests exist.

Figures

Figure 1
Figure 1. Tissue-specific over-expression of alb-SREBP-1c in vivo.
(A) Scheme of the DNA constructs used to generate transgenic mice. The transcriptionally active N-terminal domain of the human SREBP-1c gene (aa 1–436 including a 5′-HA-tag (YPYDVPDYA) was inserted into a vector construct containing the mouse albumin promoter, a liver-specific enhancer element and a polyadenylation site. The SREBP-1c expression cassette was released by BssHI restriction for microinjection into male pronuclei of zygotes derived from C57Bl6 mice. (A) Verification of transgene insertion into genomic DNA was performed by PCR. M: size marker, genomic DNA of lane 1: C57Bl6, 2: alb-SREBP-1c, and lane 3: no template control. (B) Validation of transgene expression of alb-SREBP-1c animal model on mRNA level by RT-PCR. RNA extracted from snap-frozen liver biopsies from male alb-SREBP-1c and C57Bl6 mice was analyzed by RT-PCR with transgene human SREBP-1c (HA-SREBP-1c) , mouse SREBP-1a (m-SREBP-1a), mouse SREBP-1c (m-SREBP-1c) and mouse SREBP-2 (m-SREBP-2) specific primers and probe. The relative RNA amount shown in arbitrary units was calculated and plotted ± S.D. Graphs represent data from four male mice per genotype, each analyzed in triplicate (p<0.01). (C) Verification of transgene expression on protein level in liver. Protein extracts of snap-frozen liver biopsies from lane 1: alb-SREBP-1c, 2: C57Bl6 mice were separated by SDS-PAGE and blotted on nitrocellulose membrane. The membrane was probed with HA-specific antibody to determine the HA-tag of the transgene construct. A representative experiment is shown. For normalizing, blots were probed with α-tubulin antibody. (D) Graphs show densitometry evaluation of n = 5 independent experiments. (E) Tissue-specific expression of alb-SREBP-1c. Protein extracts of lane 1: liver, 2: pancreas, 3: skeletal muscle, 4: adipose tissue, 5: heart, 6: kidney and 7: small intestine were separated by SDS-PAGE, blotted and probed with HA-specific antibody. A representative experiment is shown. The arrow indicates HA-tagged SREBP-1c. For normalizing, blots were probed with α-tubulin antibody. (F) Graphs show densitometry evaluation of n = 5 independent experiments.
Figure 2
Figure 2. Macroscopic and histological comparison of livers from C57Bl6 and alb-SREBP-1c mice.
Panel (A) shows fatty liver macroscopically of a C57Bl6 (left) or alb-SREBP-1c (right) mouse. (B) Liver tissue of the Lobus caudatus, Lobus sinister- and Lobus dexter lateralis were used for (I) standard hematoxylin and eosin staining. (II) PAS staining was performed to determine glycogen content. (III) The tissues were also used for cryofixation, and Oil-red-O staining was used for lipid visualization. (IV) Fibers and the extra cellular matrix were visualized to determine tissue integrity. The overview magnification is 1∶10, and details are shown in 1∶100 magnification.
Figure 3
Figure 3. Phenotypical comparison of C57Bl6 and transgenic alb-SREBP-1c animals.
Weight gain (A) and food intake (B) of male mice (n = 20 per genotype) were measured once a week starting at weaning and monitored for an observation period of 18 weeks. Food intake per body weight (C) and weight gain per food intake (D) were determined in each group of mice. Data are given as means including standard deviation (±S.D.). C57Bl6 vs. alb-SREBP-1c mice: **p<0.01.
Figure 4
Figure 4. Comparison of body composition of C57Bl6 and transgenic alb-SREBP-1c animals.
Body weight (A), lean body mass (B), subcutaneous adipose tissue (C), visceral adipose tissue (E) and liver weight were determined at scarification at 24 weeks of age of male mice (n = 20 per genotype) and are given directly (A, B, C, E, G) and in relation to body weight (BW) (D, F, H). C57Bl6 vs. alb-SREBP-1c mice: *p<0.05; **p<0.01.
Figure 5
Figure 5. Macroscopic comparisons of C57Bl6 and transgenic alb-SREBP-1c animals.
(A) First, sections of male mice at 24 weeks of age are shown. (B) Histology of visceral adipose tissue indicated hyperplasia but no signs of infiltration. All photographs were taken with the same magnification.
Figure 6
Figure 6. Cytokine profile secreted from isolated adipocytes of C57Bl6 and transgenic alb-SREBP-1c animals.
The cytokine content in supernatant of cultured primary adipocytes was analyzed using the Proteome Profiler™; R&D Systems, (Abingdon, UK). Spot intensities were normalized to background and positive controls set to 100% intensity. Presented numbers on membranes mark targets as follows: (1) CSF-3; (2) CSF-2; (3) CCL-1; (4) sICAM -; (5) IL-1ra; (6) IL-6; (7) CXCL-10; (8) CXCL-1; (9) CSF-1; (10) MCP-1; (11) MCP-5; (12) CXCL-9; (13) CCR-1a; (14) CXCL-2; (15) CCL-5; (16) TIMP-1. Abundance of: CXCL-13, C5a, CCL-11, IFN-γ, IL1-α, IL1-ß, IL-2, IL-3, IL-4, IL-5, IL-7, IL-10, IL-13, IL-12-p70, IL-16, IL-17, IL-23, IL-27, CXCL-11, CCL-4, CXCL-12, CCL-17, TNF-α or TREM-1 was not detected. Data are given as means ± S.D. (n = 6, each) of normalized intensity. Significance was calculated by 2-way ANOVA. C57Bl6 vs. alb-SREBP-1c mice: *p<0.01.
Figure 7
Figure 7. Cytokine profile in serum of C57Bl6 and transgenic alb-SREBP-1c animals.
The cytokine content in serum was analyzed using the Proteome Profiler™; R&D Systems, (Abingdon, UK). Spot intensities were normalized to background and positive controls set to 100% intensity. Presented numbers on membranes mark targets as follows: (1) C5a; (2) CSF-3; (3) sICAM; (4) INF-γ; (5) IL-12-p70; (6) CXCL-1; (7) CSF-1; (8) MCP-1; (9) TIMP-1; (10) TREM-1. Abundance of: CXCL13, CSF-2, CCL-1, CCL-11, IL1-α, IL1-ß, IL-1ra, IL-2, IL-3, IL-4, IL-5, IL-6, IL-7, IL-10, IL-13, IL-16, IL-17, IL-23, IL-27, CXCL-10, CXCL-11, MCP-5, CXCL-9, CCR-1a, CCL-4, CCL-2, CCL5, CXCL-12, CCL-17 or TNF-α was not detected in serum. Data are given as means ± S.D. (n = 6, each) of normalized intensity. Significance was calculated by 2-way ANOVA. C57Bl6 vs. alb-SREBP-1c mice: *p<0.01.

References

    1. Unger RH. Lipotoxic diseases. Annu Rev Med. 2002;53:19–36. - PubMed
    1. Donnelly KL, Smith CI, Schwarzenberg SJ, Jessurun J, Boldt MD, et al. Sources of fatty acids stored in liver and secreted via lipoproteins in patients with nonalcoholic fatty liver disease. J Clin. Invest. 2005;115:1343–1351. - PMC - PubMed
    1. Choi SS, Diehl AM. Hepatic triglyceride synthesis and nonalcoholic fatty liver disease. Curr Opin Lipidol. 2008;19:295–300. - PubMed
    1. Musso G, Gambino R, Cassader M. Recent insights into hepatic lipid metabolism in non-alcoholic fatty liver disease (NAFLD). Prog Lipid. 2009;48:1–26. - PubMed
    1. Parks ER, Krauss CM, Neese PR, Hellerstein M. Effects of a low-fat, high carbohydrate diet on VLDL-triglyceride assembly, production and clearance. J Clin. Invest. 1999;104:1087–1096. - PMC - PubMed

Publication types

MeSH terms