

Spatial dimensions of dengue virus transmission across interepidemic and epidemic periods in Iquitos, Peru (1999-2003)
- PMID: 22363822
- PMCID: PMC3283551
- DOI: 10.1371/journal.pntd.0001472
Spatial dimensions of dengue virus transmission across interepidemic and epidemic periods in Iquitos, Peru (1999-2003)
Abstract
Background: Knowledge of spatial patterns of dengue virus (DENV) infection is important for understanding transmission dynamics and guiding effective disease prevention strategies. Because movement of infected humans and mosquito vectors plays a role in the spread and persistence of virus, spatial dimensions of transmission can range from small household foci to large community clusters. Current understanding is limited because past analyses emphasized clinically apparent illness and did not account for the potentially large proportion of inapparent infections. In this study we analyzed both clinically apparent and overall infections to determine the extent of clustering among human DENV infections.
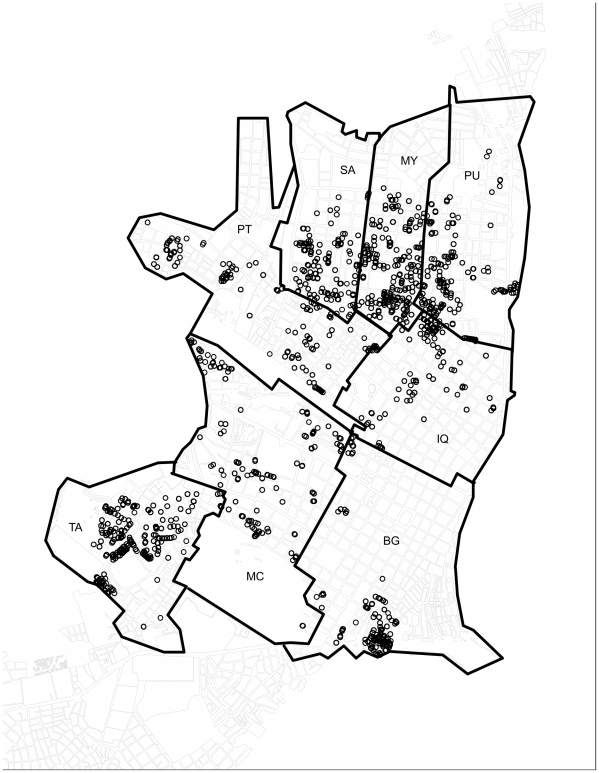
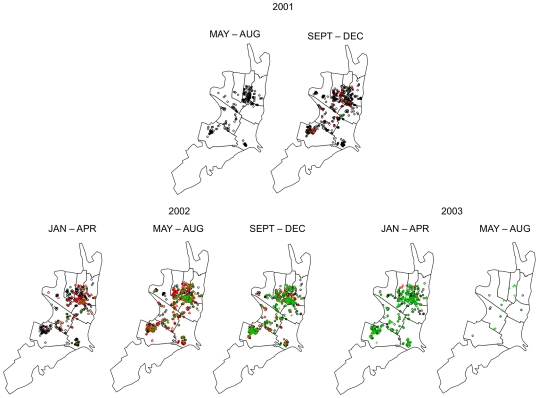
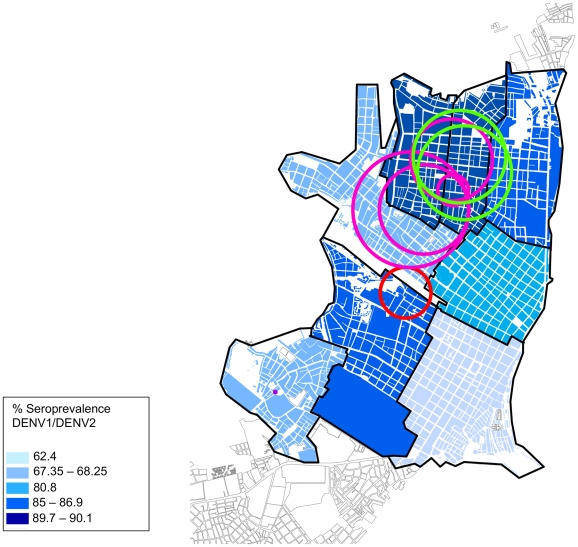
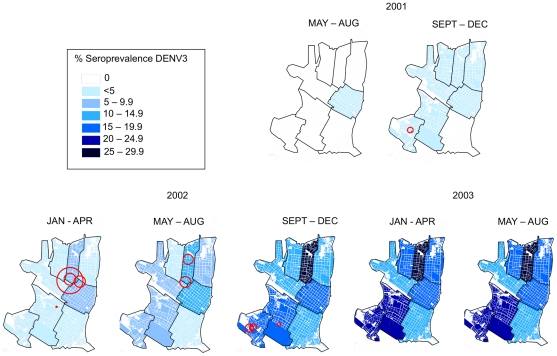
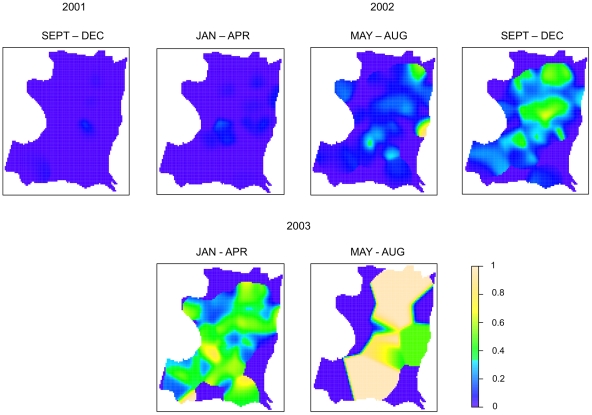
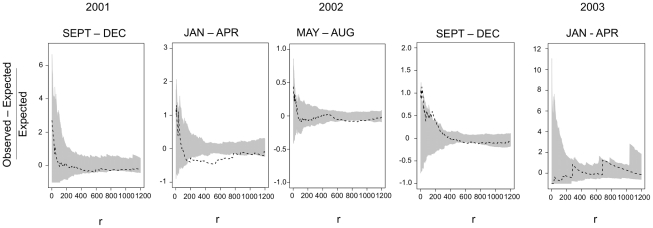
Methodology/principal findings: We conducted spatial analyses at global and local scales, using acute case and seroconversion data from a prospective longitudinal cohort in Iquitos, Peru, from 1999-2003. Our study began during a period of interepidemic DENV-1 and DENV-2 transmission and transitioned to epidemic DENV-3 transmission. Infection status was determined by seroconversion based on plaque neutralization testing of sequential blood samples taken at approximately six-month intervals, with date of infection assigned as the middate between paired samples. Each year was divided into three distinct seasonal periods of DENV transmission. Spatial heterogeneity was detected in baseline seroprevalence for DENV-1 and DENV-2. Cumulative DENV-3 seroprevalence calculated by trimester from 2001-2003 was spatially similar to preexisting DENV-1 and DENV-2 seroprevalence. Global clustering (case-control Ripley's K statistic) appeared at radii of ∼200-800 m. Local analyses (Kuldorf spatial scan statistic) identified eight DENV-1 and 15 DENV-3 clusters from 1999-2003. The number of seroconversions per cluster ranged from 3-34 with radii from zero (a single household) to 750 m; 65% of clusters had radii >100 m. No clustering was detected among clinically apparent infections.
Conclusions/significance: Seroprevalence of previously circulating DENV serotypes can be a predictor of transmission risk for a different invading serotype and, thus, identify targets for strategically placed surveillance and intervention. Seroprevalence of a specific serotype is also important, but does not preclude other contributing factors, such as mosquito density, in determining where transmission of that virus will occur. Regardless of the epidemiological context or virus serotype, human movement appears to be an important factor in defining the spatial dimensions of DENV transmission and, thus, should be considered in the design and evaluation of surveillance and intervention strategies.
Conflict of interest statement
The authors have declared that no competing interests exist.
Figures
References
-
- Gubler DJ. Epidemic dengue/dengue hemorrhagic fever as a public health, social and economic problem in the 21st century. Trends Microbiol. 2002;10:100–103. - PubMed
-
- Halstead SB. Dengue virus - Mosquito interactions. Annu Rev Entomol. 2008;53:273–291. - PubMed
-
- Harrington LC, Scott TW, Lerdthusnee K, Coleman RC, Costero A, et al. Dispersal of the dengue vector Aedes aegypti within and between rural communities. Am J Trop Med Hyg. 2005;72:209–220. - PubMed
-
- Scott TW, Chow E, Strickman D, Kittayapong P, Wirtz RA, et al. Blood-Feeding Patterns of Aedes-Aegypti (Diptera, Culicidae) Collected in a Rural Thai Village. J Med Entomol. 1993;30:922–927. - PubMed
Publication types
MeSH terms
Substances
LinkOut - more resources
Full Text Sources
Medical
Miscellaneous
