. 2012 Feb 24;4(2):16.
doi: 10.1186/gm315.

Systems-level analysis of age-related macular degeneration reveals global biomarkers and phenotype-specific functional networks

Affiliations

Systems-level analysis of age-related macular degeneration reveals global biomarkers and phenotype-specific functional networks

Aaron M Newman et al. Genome Med. .

Abstract

Please see related commentary: http://www.biomedcentral.com/1741-7015/10/21/abstract

Background: Age-related macular degeneration (AMD) is a leading cause of blindness that affects the central region of the retinal pigmented epithelium (RPE), choroid, and neural retina. Initially characterized by an accumulation of sub-RPE deposits, AMD leads to progressive retinal degeneration, and in advanced cases, irreversible vision loss. Although genetic analysis, animal models, and cell culture systems have yielded important insights into AMD, the molecular pathways underlying AMD's onset and progression remain poorly delineated. We sought to better understand the molecular underpinnings of this devastating disease by performing the first comparative transcriptome analysis of AMD and normal human donor eyes.

Methods: RPE-choroid and retina tissue samples were obtained from a common cohort of 31 normal, 26 AMD, and 11 potential pre-AMD human donor eyes. Transcriptome profiles were generated for macular and extramacular regions, and statistical and bioinformatic methods were employed to identify disease-associated gene signatures and functionally enriched protein association networks. Selected genes of high significance were validated using an independent donor cohort.

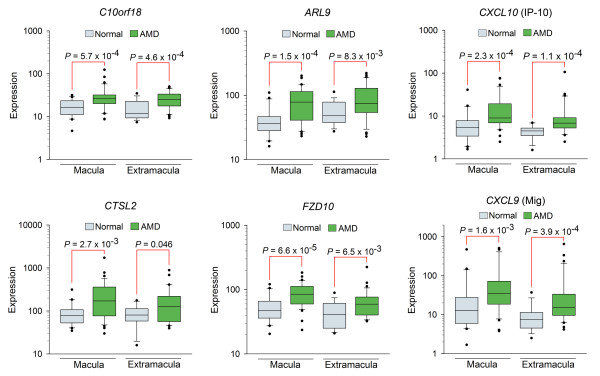
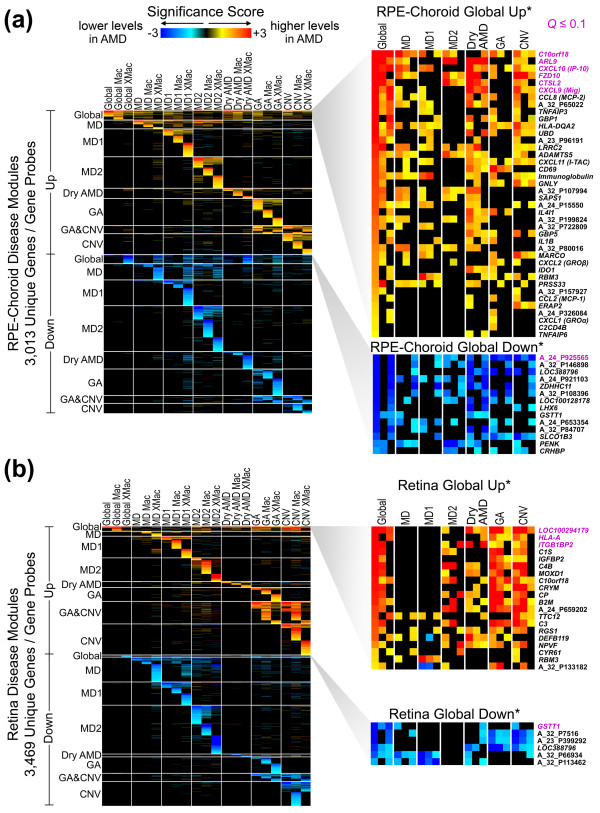
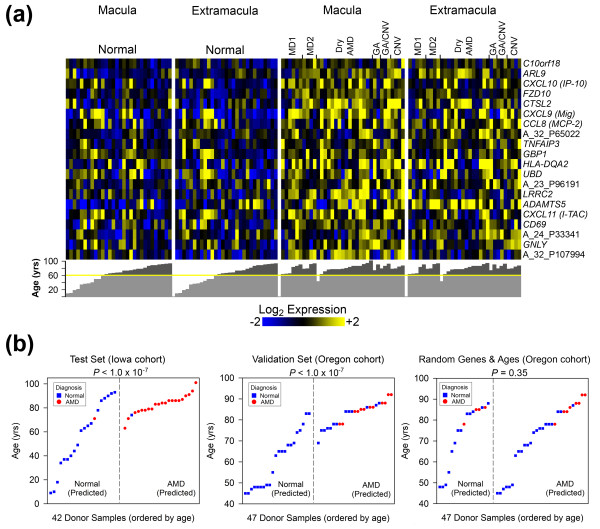
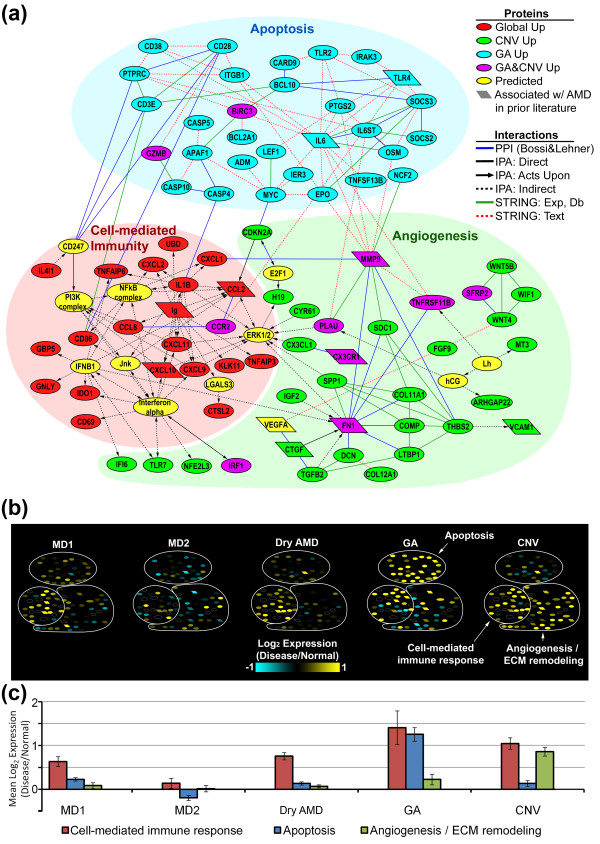
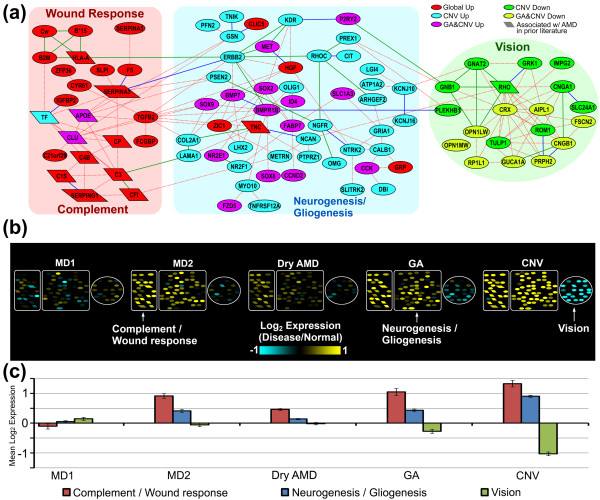
Results: We identified over 50 annotated genes enriched in cell-mediated immune responses that are globally over-expressed in RPE-choroid AMD phenotypes. Using a machine learning model and a second donor cohort, we show that the top 20 global genes are predictive of AMD clinical diagnosis. We also discovered functionally enriched gene sets in the RPE-choroid that delineate the advanced AMD phenotypes, neovascular AMD and geographic atrophy. Moreover, we identified a graded increase of transcript levels in the retina related to wound response, complement cascade, and neurogenesis that strongly correlates with decreased levels of phototransduction transcripts and increased AMD severity. Based on our findings, we assembled protein-protein interactomes that highlight functional networks likely to be involved in AMD pathogenesis.

Conclusions: We discovered new global biomarkers and gene expression signatures of AMD. These results are consistent with a model whereby cell-based inflammatory responses represent a central feature of AMD etiology, and depending on genetics, environment, or stochastic factors, may give rise to the advanced AMD phenotypes characterized by angiogenesis and/or cell death. Genes regulating these immunological activities, along with numerous other genes identified here, represent promising new targets for AMD-directed therapeutics and diagnostics.


Figures

Figure 1
Figure 1
RPE-choroid genes with significantly elevated transcript levels in AMD. Box plots of age-matched normal and AMD (including pre-AMD) donor samples from the macular and extramacular RPE-choroid. All genes have a q-value ≤ 0.1 (false discovery rate ≤ 10%). Macular and extramacular P-values were calculated using a one-sided Wilcoxon rank-sum test. 'Expression' denotes net intensity, as defined in Materials and methods. Normal macula, n = 30; AMD macula, n = 35; Normal extramacula, n = 29; AMD extramacula, n = 32.
Figure 2
Figure 2
Global and phenotype-specific AMD disease modules. (a, b) Disease-associated genes with permuted P-value < 0.1 and fold difference ≥ 1.5 were clustered based on their significance score (see Materials and methods), and the results are displayed as heat maps for RPE-choroid (a) and retina (b). Columns represent each disease phenotype, macula (Mac) and/or extramacula (XMac), and rows represent unique genes/probes (gene symbols/Agilent ID). Global includes all AMD/pre-AMD phenotype classifications, and MD is composed of both MD1 and MD2 donor samples. GA and CNV disease classes include GA/CNV donor samples. Disease modules are separated by horizontal lines and labeled by higher or lower expression in one or more AMD/pre-AMD phenotypes (for example, 'MD2 Up', 'GA Down') compared to age-matched normal donor samples. Global Up*/Global Down* disease modules enlarged on the right highlight individual genes with significant differential expression in both macular and extramacular donor samples; for the entire list of Global Up/Down genes, see Figures S7 and S8 in Additional file 1 and Table S3 in Additional file 5. Immunoglobulin probes are averaged to conserve space, as described in Materials and methods.
Figure 3
Figure 3
Validation of global AMD signature genes with an independent cohort. Using a support vector machine (SVM) and the 20 most significant genes in the RPE-choroid Global Up module (Figure 2a), a classification model for predicting AMD status was developed. (a) Expression heat map (log2 scaled, median-centered) of the genes/probes from the Iowa donor set used to generate the classification model. All donor ages are plotted under the heat map (yellow line indicates point at which donors become age-matched). (b) Results obtained using an AMD SVM model that incorporates expression data and age to identify AMD donors in: a subset of the Iowa data that was not used for training (that is, 'Test Set'), the Oregon dataset (that is, 'Validation Set'), and a randomized Oregon dataset (that is, 'Random Genes and Ages'). These results correspond to 'SVM Model 2 (+Age)', which is detailed along with other SVM models in Figures S9 and S10 in Additional file 1. Statistical significance was determined as described in Materials and methods.
Figure 4
Figure 4
RPE-choroid AMD interactome: globally conserved and phenotype-specific subnetworks. (a) AMD interactome showing direct and indirect protein-protein interactions within RPE-choroid Global Up, CNV Up and GA Up disease modules assembled from three data sources: STRING [49], Ingenuity Pathway Analyzer (IPA), and the Bossi and Lehner [50] human protein-protein interaction dataset (PPI) (see Materials and methods). Gene products are represented by nodes, most of which are color-coded according to disease module. Yellow nodes represent genes predicted by IPA, with the exception of VEGFA, which was predicted manually and is highly expressed in our RPE-choroid expression data. Parallelogram-shaped nodes denote genes previously associated with AMD (Table S2 in Additional file 3). Individual immunoglobulin genes/probes in the Global Up module were combined (see Materials and methods) and are represented as a single node ('Ig'). Exp, Db, and Text indicate Experimental, Knowledge/Database, and Text-mining components of the STRING interaction score, respectively. (b) Heat maps depict differential expression of network genes in the macula of each AMD/pre-AMD phenotype (also see Figure S12 in Additional file 1). Differential expression was calculated as the geometric mean of each gene normalized to age-matched normal donor samples (≥ 60 years). Only pure GA and CNV are represented. (For data including GA/CNV donor samples, see Figure S12 in Additional file 1). (c) Bar plot depicting mean of expression data in (b), shown as a function of AMD/pre-AMD phenotype. Error bars represent standard error of the mean.
Figure 5
Figure 5
Retina AMD interactome shows graded expression across AMD phenotypes. (a) AMD interactome assembled from retina Global Up, CNV Up and CNV Down disease modules assembled from three data sources: STRING [49], Ingenuity Pathway Analyzer (IPA), and the Bossi and Lehner [50] human protein-protein interaction dataset (PPI) (see Materials and methods). Parallelogram-shaped nodes indicate genes previously associated with AMD (Table S2 in Additional file 3). Exp, Db, and Text indicate Experimental, Knowledge/Database, and Text-mining components of the STRING interaction score, respectively. (b) Heat maps depicting macular expression levels as a function of AMD and pre-AMD phenotype (also see Figure S13 in Additional file 1). Expression levels were calculated as described in Figure 4. (c) Mean differential expression for each subnetwork in (b), organized by AMD/pre-AMD phenotype. Error bars represent standard error of the mean.

References

    1. Cohen LH, Noell WK. In: Biochemistry of the Retina. Graymor CN, editor. Orlando, FL: Academic Press Inc; 1965. Relationships between visual function and metabolism. pp. 35–50.
    1. Wangsa-Wirawan ND, Linsenmeier RA. Retinal oxygen: fundamental and clinical aspects. Arch Ophthalmol. 2003;121:547–557. doi: 10.1001/archopht.121.4.547. - DOI - PubMed
    1. Foulds WS. The choroidal circulation and retinal metabolism - an overview. Eye. 1990;4:243–248. doi: 10.1038/eye.1990.35. - DOI - PubMed
    1. Klein R, Chou CF, Klein BE, Zhang X, Meuer SM, Saaddine JB. Prevalence of age-related macular degeneration in the US population. Arch Ophthalmol. 2011;129:75–80. doi: 10.1001/archophthalmol.2010.318. - DOI - PubMed
    1. Bird AC, Bressler NM, Bressler SB, Chisholm IH, Coscas G, Davis MD, de Jong PT, Klaver CC, Klein BE, Klein R, Mitchell P, Sarks JP, Sarks SH, Soubrane G, Taylor HR, Vingerling JR. An international classification and grading system for age-related maculopathy and age-related macular degeneration. Surv Ophthalmol. 1995;39:367–374. doi: 10.1016/S0039-6257(05)80092-X. - DOI - PubMed