. 2012 Mar 29:1446:1-11.
doi: 10.1016/j.brainres.2012.01.046. Epub 2012 Jan 28.

Effects of dexpramipexole on brain mitochondrial conductances and cellular bioenergetic efficiency

Affiliations

Effects of dexpramipexole on brain mitochondrial conductances and cellular bioenergetic efficiency

Kambiz N Alavian et al. Brain Res. .

Abstract

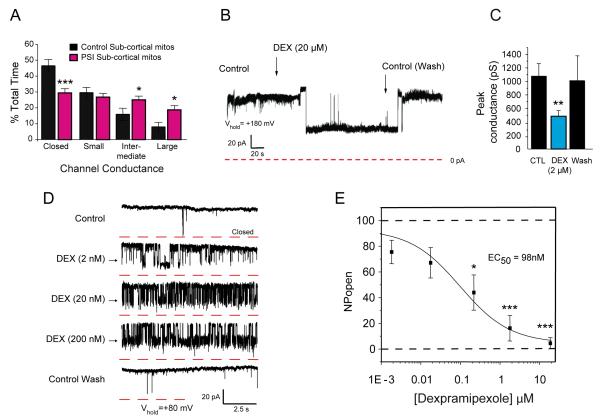
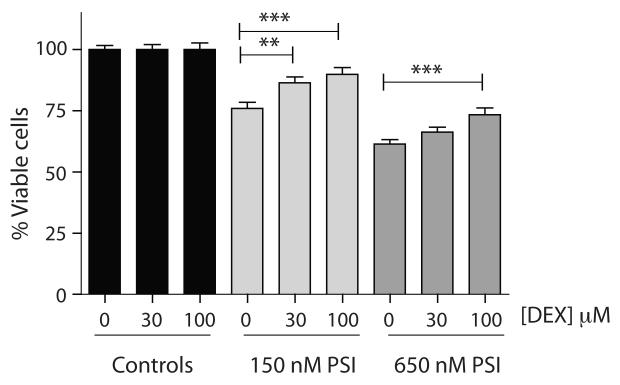
Cellular stress or injury can result in mitochondrial dysfunction, which has been linked to many chronic neurological disorders including amyotrophic lateral sclerosis (ALS) and Parkinson's disease (PD). Stressed and dysfunctional mitochondria exhibit an increase in large conductance mitochondrial membrane currents and a decrease in bioenergetic efficiency. Inefficient energy production puts cells, and particularly neurons, at risk of death when energy demands exceed cellular energy production. Here we show that the candidate ALS drug dexpramipexole (DEX; KNS-760704; ((6R)-4,5,6,7-tetrahydro-N6-propyl-2,6-benzothiazole-diamine) and cyclosporine A (CSA) inhibited increases in ion conductance in whole rat brain-derived mitochondria induced by calcium or treatment with a proteasome inhibitor, although only CSA inhibited calcium-induced permeability transition in liver-derived mitochondria. In several cell lines, including cortical neurons in culture, DEX significantly decreased oxygen consumption while maintaining or increasing production of adenosine triphosphate (ATP). DEX also normalized the metabolic profile of injured cells and was protective against the cytotoxic effects of proteasome inhibition. These data indicate that DEX increases the efficiency of oxidative phosphorylation, possibly by inhibition of a CSA-sensitive mitochondrial conductance.


Figures

FIGURE 1
FIGURE 1
DEX inhibited PSI-induced currents in brain-derived mitochondria. A. Histograms show the % total time that patches displayed specified conductance levels in all recorded traces (n=190 recordings from a total of 10 PSI-exposed sub-cortical mitochondria, n=83 recordings from a total of 9 vehicle (DMSO)-exposed sub-cortical mitochondria). Conductance level frequencies for PSI-dosed mitochondria compared with the comparable level in non-PSI-dosed mitochondria, using 2-tailed unpaired t-tests; p=0.0005 for closed PSI-mitochondria compared to closed control, p=0.0426 for intermediate conductance PSI-mitochondria compared to intermediate control, p=0.0192 for large PSI-mitochondrial conductance compared to large control. In all figures, the specific analyses performed and unadjusted or adjusted p values connoting significance are presented in the figure legend. The general level of significance obtained when comparing 2 groups, including pre-planned post hoc comparisons, is indicated on any figure by the number of asterisks above or below the mean value; *=p<0.05, **=p<0.01, ***=p<0.0001.–B. Example of a continuous patch clamp recording from a PSI-mitochondrion before and after bath application of DEX. C. Group data showing peak conductance recorded from mitochondria isolated from subcortex of PSI-injected rats (n=15 mitochondria, except for wash, where n=6 mitochondria). 2-tailed paired t-test, p=0.0352. The wash was not included in the analysis. D. Intermediate-conductance (~500pS) channels recorded from PSI mitochondria before and after DEX and after wash at the indicated concentrations. Holding potential = + 80 mV. Note that in this example many closures reveal sub-conductance states. Sample recordings were obtained at steady-state for each condition. E. Mean inhibitory effect of different concentrations of DEX on NPo, recorded in brain-derived PSI-mitochondria (n=5 mitochondria for all except 20μM, where n=9). One-way ANOVA, p=.000014; pre-planned post hoc comparisons, Bonferroni corrected t-tests, p=0.0455 for 200nM DEX, p=0.00038 for 2μM DEX, p=0.0005 for 20μM DEX; EC50=98nM by logistic fit; Hill slope, nH<1.
FIGURE 2
FIGURE 2
CSA and DEX have similar effects on brain mitochondrial currents, but not on permeability transition in liver mitochondria. A. (Left) Bar graph of mean level of inhibition of peak conductance by 1μM CSA in recordings from PSI-mitochondria (n=7 mitochondria); p=0.0003, paired t-test. (Right) Bar graph of the mean inhibition of peak conductance by 200nM DEX in PSI-mitochondria, wash (>5 min.) and1.0μM CSA (n=3 mitochondria). B. (Left) Bar chart of the mean effect of 100μM Ca2+ on peak membrane conductance (in pS) (n=14 mitochondria); p=0.0092, 2-tailed paired t-test. (Right) Bar chart of the mean inhibition of peak conductance (in pS) by 20μM DEX in the continued presence of Ca2+ (n=7 mitochondria); p=0.0094, 2-tailed paired t-test; n=4 for wash; the wash was not included in the analyses. C. Optical absorbance of fresh, respiring rat liver mitochondria (measured respiratory control ratio >5) before and during Ca2+-induced permeability transition, and its amerlioration by LiCl and CSA, but not DEX. Each point represents the mean±SEM for the group at each time point; n≥12 wells for each condition.
FIGURE 3
FIGURE 3
DEX modulation of cellular bioenergetics. A. Effect of DEX (10μM, 12 hr. incubation prior to measurements) on ATP levels, measured in a luciferase assay in cultured hippocampal neurons (n=21 wells each condition, 2 independent cultures, p=0.0024, unpaired t-test). B. Image of an oxygen-sensitive electrode placed in position to record oxygen uptake by a single cultured hippocampal neuron. Shown are the recording and self-referencing positions of the electrode. Scale bar with arrow represents 10μm; measurement of oxygen level in proximity of neurons occurred ~1-2μM from cell surface and the reference point was 10-12μM away from cell surface. C. Single self-referencing oxygen electrode recording from a cultured hippocampal neuron after addition of DEX (10μM) or an equivalent volume of water to the bath. D. Histogram of group data (mean ± SEM) for recordings as in C before and after addition of DEX (10μM; n=14 neurons) or an equivalent volume of water (n=6 neurons). Unpaired t-test, p≤0.0001. E. Effect of DEX on OCR on rat cortical cultures exposed to digitonin(10μg/ml) and rotenone (100nM) (45 min.) followed by succinate and ADP injection. Oxygen consumption rate (OCR) was measured by a Seahorse® flux analyzer. OCR at baseline (i.), 30μM DEX (n=10 wells) or vehicle injection (n=10 wells) (ii.), 10mM succinate (iii.), 1mM ADP (iv.) and 10μM antimycin A (v.). 10 wells/treatment. F. Group histograms illustrating the effect of DEX on OCR under the indicated conditions relative to control values ± SEM. For succinate, p=0.1211 (2-tailed t-test). For ADP injection, p=0.0001 (2-tailed t-test). Primary rat cortical cultures, from several separate isolations and multiple independent plates, were pretreated with DEX (30μM; n=95 wells) or control medium (n=94 wells) for 1 hr., then incubated with digitonin (10μg/ml), rotenone (100nM), and DEX (30μM) prior to OCR measurements. G. Initial slope of ATP production following ADP addition in isolated cortical neurons in absence and presence of 30μM DEX. Third bar indicates ATP level after antimycin A (AMA) addition at end of experiment. H. Maximal level of ATP production for experiment shown in G. I. Citrate synthase levels in absence and presence of 30μM DEX after the flux experiments in F (n=17 wells/treatment arm).
FIGURE 4
FIGURE 4
Dexpramipexole enhances mitochondrial metabolism in cells grown in a medium where glucose is replaced with galactose. SH-SY5Y neuroblastoma cells were exposed to the indicated concentrations of dexpramipexole for 24 hr. before measurement of ATP levels by a luciferin-luciferase assay. Data shown represent mean±SEM. Statistical analyses: 1-Way-ANOVA, p=0.0001 for both normal and galactose medium; pre-planned post hoc comparisons (Bonferroni corrected t-tests) for normal medium and galactose medium, respectively, p=0.0068 and p=0.0018 for 1 μM, p=0.0013 and p=0.0039 for 3 μM, p=0.0001 (galactose) for 10 μM, p=0.0009 and p=0.0001 for 30 μM, p=0.0129 (galactose) for 100 μM dexpramipexole; n=14-17 wells/concentration for each substrate).
FIGURE 5
FIGURE 5
DEX altered bioenergetic parameters and ATP production in the C2C12 myoblast cell line. A. Cellular viability of C2C12 cells after 18 hr. exposure to PSI at indicated concentrations. Data are presented as a percentage of the vehicle-treated control ±SEM (n=10 wells at each concentration). A sub-lethal concentration of PSI, 30nM, was used in subsequent experiments to stress C2C12 cells. B. (Left) ATP levels (%control) after18 hr exposure to indicated agents. (2-way-ANOVA; p=0.1763; n=18 wells for each group). (Right) cell viability after18 hr exposure to indicated agents (2-way-ANOVA, p=0.2824). Data are presented as a percentage of the vehicle-treated control±SEM (n = 14-17 wells for each group; for all conditions multiple plates and cell platings contributed to all data obtained). C. (Left) Oxygen consumption rate (OCR) and (Right) extracellular acidification rate (ECAR) of cells exposed to DEX (30μM) and/or PSI (30nM), or no drug (control) for 18 hr. (control, black bars, n=27; DEX, n=24; PSI, n=12, from 5 independent multiwell plates, from multiple cell platings). (*p=0.0477; **p=0.0002, blue bars). ***p=0.00015, gray bar; (n=9, OCAR ***p=0.0009, red bars). Data are expressed as a percentage of the corresponding control OCR or ECAR value, and p values represent results of pre-planned post hoc comparisons (Tukey HSD) following one-way ANOVA (p=0.001). Data shown represent mean±SEM.
FIGURE 6
FIGURE 6
Exposure of SH-SY5Y cells to high concentrations of PSI compromises cell viability. Cells were pre-treated with DEX for 24 hr. prior to 24 hr. exposure to PSI at indicated concentrations. Pre-exposure to dexpramipexole (DEX) significantly reduced the PSI-mediated cell death (2-factor MANOVA, DEX+150 nM PSI vs. 150 nM PSI, p=0.001, DEX+650 nM PSI vs. 650 nM PSI, p=0.001; pre-planned post hoc Bonferroni-corrected t-tests, 150 nM PSI vs. 150 nM PSI + 30 μM DEX, p=0.031; 150 nM PSI + 100 μM DEX, p=0.001; 650 nM PSI + 100 μM DEX, p=0.001; all other comparisons were not statistically significant). Bar graphs represent normalized mean±SEM; n=41-98 wells/condition.

References

    1. Abramova NA, Cassarino DS, Khan SM, Painter TW, Bennett JP., Jr. Inhibition by R(+) or S(−) pramipexole of caspase activation and cell death induced by methylpyridinium ion or beta amyloid peptide in SH-SY5Y neuroblastoma. Journal of Neuroscience Research. 2002;67:494–500. - PubMed
    1. Alavian L, Collis, Bonanni, Zeng, Sacchetti, Lazrove, Nabili, Flaherty, Graham, Chen, Messerli, Mariggio, Rahner, McNay, Shore, Smith, Hardwick, Jonas Bcl-x(L) regulates metabolic efficiency of neurons through interaction with the mitochondrial F(1)F(O) ATP synthase. Nat Cell Biol. 2011;13:1224–33. - PMC - PubMed
    1. Andrews ZB, Diano S, Horvath TL. Mitochondrial uncoupling proteins in the CNS: in support of function and survival. Nature Reviews Neuroscience. 2005;6:829–40. - PubMed
    1. Azzolin L, von Stockum S, Basso E, Petronilli V, Forte MA, Bernardi P. The mitochondrial permeability transition from yeast to mammals. FEBS Letters. 584:2504–9. - PMC - PubMed
    1. Bandopadhyay R, de Belleroche J. Pathogenesis of Parkinson’s disease: emerging role of molecular chaperones. Trends in Molecular Medicine. 2010;16:27–36. - PubMed

Publication types

MeSH terms