. 2012 Feb 24;19(2):218-27.
doi: 10.1016/j.chembiol.2011.12.016.

Cholesterol catabolism by Mycobacterium tuberculosis requires transcriptional and metabolic adaptations

Affiliations

Cholesterol catabolism by Mycobacterium tuberculosis requires transcriptional and metabolic adaptations

Jennifer E Griffin et al. Chem Biol. .

Erratum in

  • Chem Biol. 2012 Sep 21;19(9):1210

Abstract

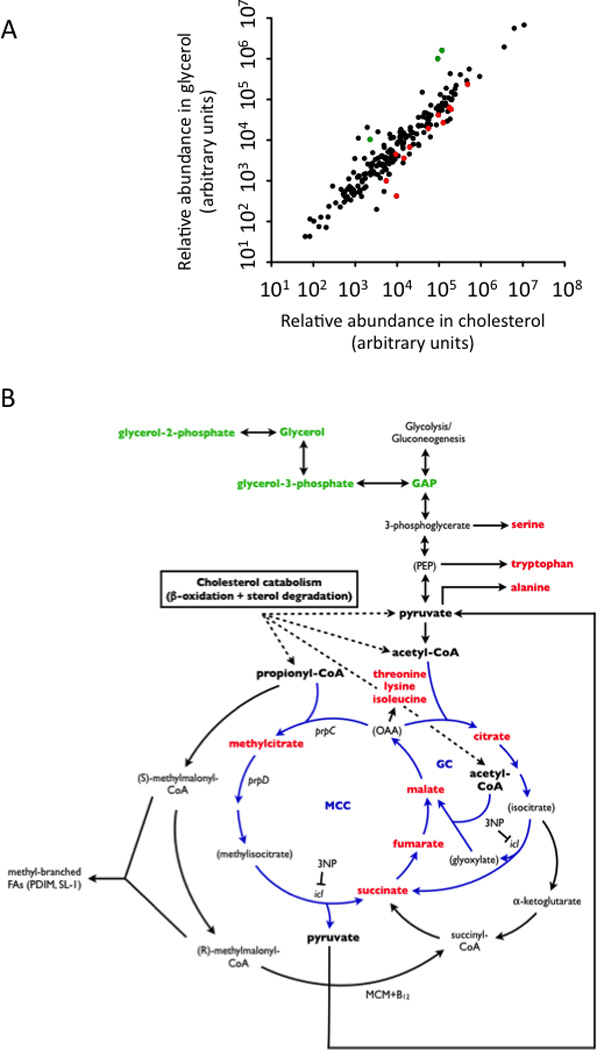
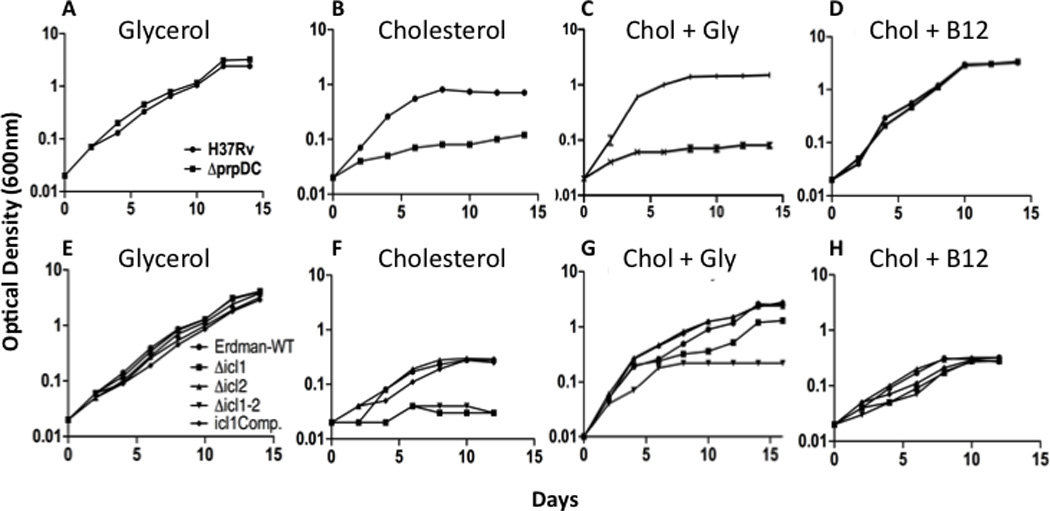
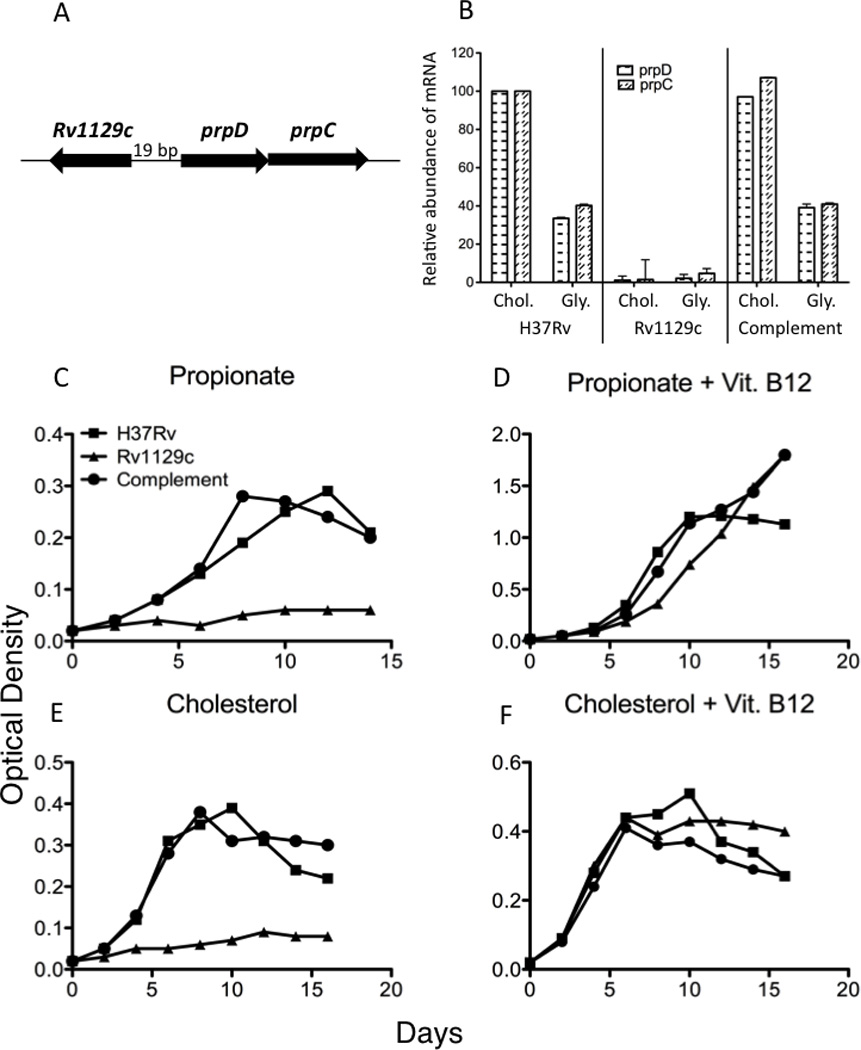
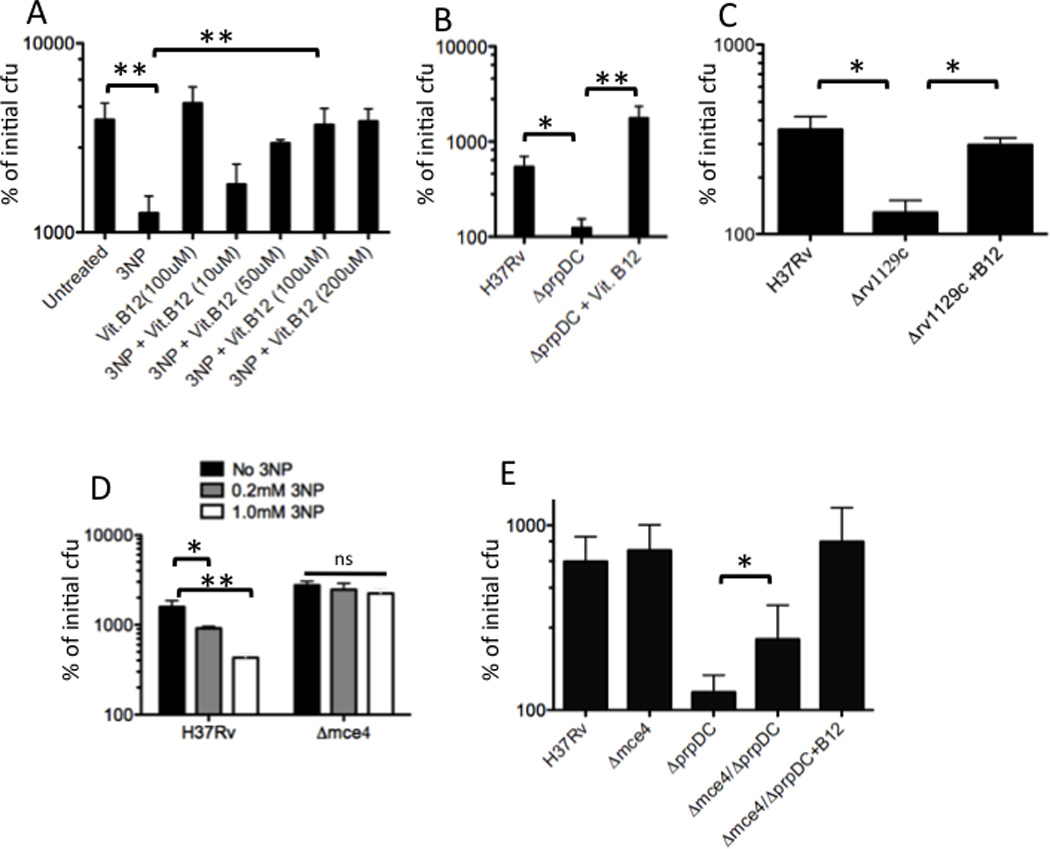
To understand the adaptation of Mycobacterium tuberculosis to the intracellular environment, we used comprehensive metabolite profiling to identify the biochemical pathways utilized during growth on cholesterol, a critical carbon source during chronic infection. Metabolic alterations observed during cholesterol catabolism centered on propionyl-CoA and pyruvate pools. Consequently, growth on this substrate required the transcriptional induction of the propionyl-CoA-assimilating methylcitrate cycle (MCC) enzymes, via the Rv1129c regulatory protein. We show that both Rv1129c and the MCC enzymes are required for intracellular growth in macrophages and that the growth defect of MCC mutants is largely attributable to the degradation of host-derived cholesterol. Together, these observations define a coordinated transcriptional and metabolic adaptation that is required for scavenging carbon during intracellular growth.


Figures

Figure 1
Figure 1. Growth on cholesterol causes metabolic changes consistent with increased MCC flux
Quadruplicate samples of Mtb were grown with either cholesterol or glycerol as primary carbon sources and LC/MS and GC/MS were used to quantify the relative abundance of primary metabolites. (A) The average relative abundance of each metabolite in glycerol- or cholesterol-grown bacteria is plotted. A subset of the differentially abundant metabolites are colored in red or green to represent their accumulation in either cholesterol- or glycerol-fed cultures, respectively. These metabolites are highlighted in the same color in panel B and described in Table 1. (B) Differentially represented metabolites indicate increased MCC flux and are shown in relation to the relevant carbon metabolic pathways. Both the methylcitrate cycle (MCC) and the glyoxylate cycle (GC) are highlighted in blue. The predicted catabolism of cholesterol into acetyl-CoA, propionyl-CoA, and pyruvate (Van der Geize et al., 2007) is indicated. The B12-dependent methylmalonyl CoA mutase (MCM) is also shown. See Supplementary Tables 1 and 2 for details regarding metabolite quantification and identification, respectively.
Figure 2
Figure 2. Cholesterol sidechain-derived propionate is incorporated into SL-1 and increases the mass of this lipid
(A) The cholesterol molecule. Carbon 26 is indicated. (B) Total polar lipids were extracted from [26-14C]-cholesterol-(lane 1) and [1,2-14C]-acetate (lane 2)-fed bacteria, separated by thin layer chromatography, and detected by autoradiography. (C) The major species labeled by cholesterol was isolated and identified as SL-1 using ESI-TOF MS. The m/z peaks depicted match the previously described lipoforms of SL-1 (Kumar et al., 2007). TLC purified samples of SL-1 from cholesterol- or glycerol-fed bacteria were compared to demonstrate that growth on cholesterol increased the mass of SL-1.
Figure 3
Figure 3. The methylcitrate cycle is required for the metabolism of cholesterol-derived propionate
The indicated mutants were grown in the presence of 0.1% glycerol (A, E), 0.01% cholesterol (B, F), or 0.01% cholesterol and 0.1% glycerol (C, G) as primary carbon sources. Vitamin B12 supplementation (D, H) allowed all mutants to grow using cholesterol. Optical density was measured at the indicated time points and is plotted on a log scale. prpDC mutants were generated in the H37Rv strain, and icl1/2 mutants were derived from the Erdman strain.
Figure 4
Figure 4. The transcriptional activation of MCC genes by Rv1129c is required for growth in cholesterol
(A) Genomic organization of rv1129c and the prpDC genes. (B) Rv1129c was required for both basal prpDC expression and for the induction of these genes in cholesterol media. Quantitative PCR was used to measure the relative abundance of prpD and prpC mRNA after 48hrs of growth in either 0.01% cholesterol or 0.1% glycerol as primary carbon sources. Error bars indicate standard deviation of triplicate samples. (C–F) Rv1129c is required for growth on propionyl-CoA-generating substrates. Bacteria were cultured in the indicated defined primary carbon sources with or without vitamin B12 and growth was monitored by optical density. Data are representative of three independent experiments.
Figure 5
Figure 5. Cholesterol is an intracellular source of propionate
(A and B) Methylcitrate cycle activity is required for propionyl-CoA metabolism during intracellular growth. BMDM were infected with the indicated strains. The MCC was inhibited either by addition of 3NP to block ICL/MCL activity (A), or by genetic deletion of the prpDC genes (B). Vitamin B12 was added to enable the methylmalonyl pathway. The number of intracellular bacteria at day 6 post-infection are plotted relative to the number of initial cell-associated cfu. C) Transcriptional activation of prpDC is required for intracellular growth. BMDM were infected with H37Rv or the Δ1129c mutant, and the cfu present on day 6 are presented as in A. (D) Mce4 mutants are relatively resistant to 3NP treatment during intracellular growth. BMDM were infected with H37Rv or Δmce4 mutant bacteria in the presence or absence of the indicated doses of 3NP. Intracellular cfu at day 6 are plotted. E) Mce4 mutation partially suppresses the intracellular growth defect of the ΔprpDC mutant. Cfu detected after 6 days of intracellular growth are presented. Each experiment in this figure was performed at least twice. Representative experiments are shown in A–D, and error bars indicate standard deviation of triplicate or quadruplicate samples. Panel E represents the average of 3 independent experiments. Statistical significance was calculated by Student’s t-test. “ns”, “*” and “**” indicate p values >0.05, < 0.05 and <0.005, respectively.

References

    1. Appelberg R. Macrophage nutriprive antimicrobial mechanisms. J Leukoc Biol. 2006;79:1117–1128. - PubMed
    1. Brock M, Buckel W. On the mechanism of action of the antifungal agent propionate. Eur J Biochem. 2004;271:3227–3241. - PubMed
    1. Chan J, Tanaka K, Carroll D, Flynn J, Bloom BR. Effects of nitric oxide synthase inhibitors on murine infection with Mycobacterium tuberculosis. Infect Immun. 1995;63:736–740. - PMC - PubMed
    1. Chang JC, Harik NS, Liao RP, Sherman DR. Identification of Mycobacterial genes that alter growth and pathology in macrophages and in mice. J Infect Dis. 2007;196:788–795. - PubMed
    1. Chang JC, Miner MD, Pandey AK, Gill WP, Harik NS, Sassetti CM, Sherman DR. igr Genes and Mycobacterium tuberculosis cholesterol metabolism. J Bacteriol. 2009;191:5232–5239. - PMC - PubMed

Publication types