

Adding the spatial dimension to the social network analysis of an epidemic: investigation of the 2007 outbreak of equine influenza in Australia
- PMID: 22365721
- PMCID: PMC7126086
- DOI: 10.1016/j.prevetmed.2012.01.020
Adding the spatial dimension to the social network analysis of an epidemic: investigation of the 2007 outbreak of equine influenza in Australia
Abstract
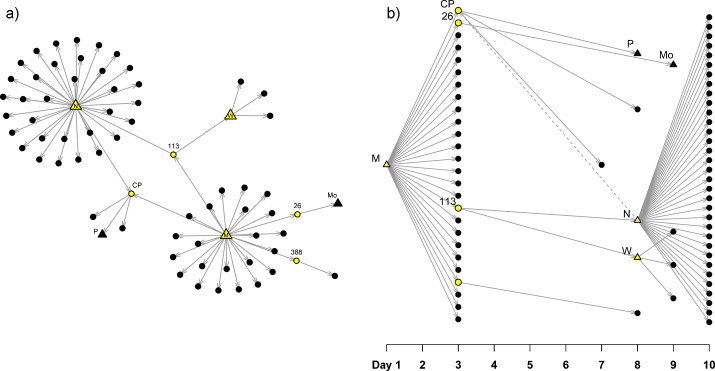
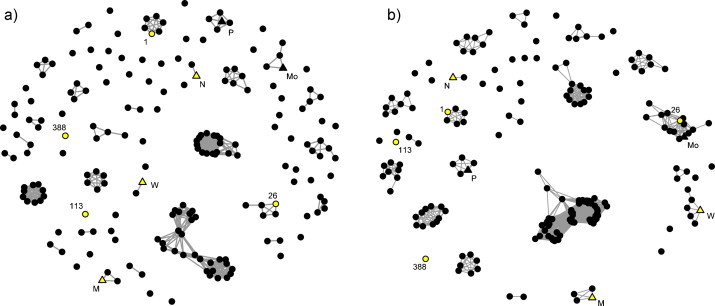
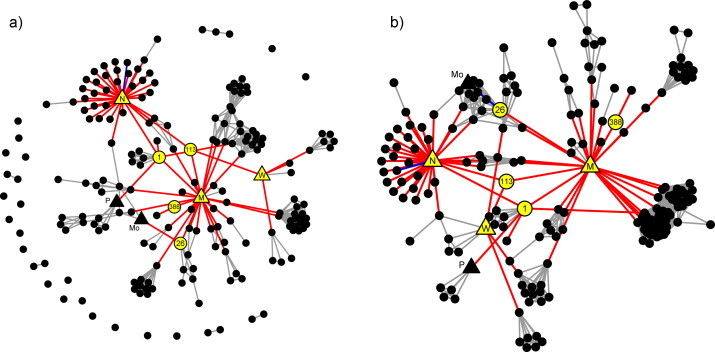
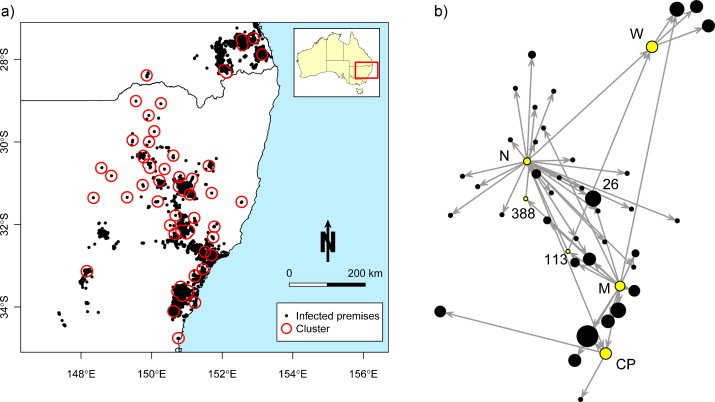
Equine influenza is a highly contagious and widespread viral respiratory disease of horses and other equid species, characterised by fever and a harsh dry cough. In 2007, in the first reported outbreak in Australia, the virus spread through the horse populations of two states within 4 months. Most of the geographic spread occurred within the first 10 days and was associated with the movement of infected horses prior to the implementation of movement controls. This study applies social network analysis to describe spread of equine influenza between horse premises infected in the early outbreak period, identifying spread occurring through a contact network and secondary local spatial spread. Social networks were constructed by combining contact-tracing data on horse movements with a distance matrix between all premises holding horses infected within the first 10 days of the outbreak. These networks were analysed to provide a description of the epidemic, identify premises that were central to disease spread and to estimate the relative proportion of premises infected through infected horse movements and through local spatial spread. We then explored the effect of distance on disease spread by estimating the range of local spread (through direct contact, transmission on fomites and windborne transmission) based on the level of fragmentation in the network and also by directly estimating the shape of the outbreak's spatial transmission kernel. During the first 10 days of this epidemic, 197 horse premises were infected; 70 of these were included in the contact-traced network. Most local spread occurred within 5 km. Local spread was estimated to have occurred up to a distance of 15.3 km - based on the contact-and-proximity network - and at a very low incidence beyond this distance based on the transmission kernel estimate. Of the 70 premises in the contact network, spread to 14 premises (95% CI: 9, 20 premises) was likely to have occurred through local spatial spread from nearby infected premises, suggesting that 28.3% of spread in the early epidemic period was 'network-associated' (95% CI: 25.6, 31.0%). By constructing a 'maximal network' of contact and proximity (based on a distance cut-off of 15.3 km), 44 spatial clusters were described, and the horse movements that initiated infection in these locations were identified. Characteristics of the combined network, incorporating both spatial and underlying contact relationships between infected premises, explained the high rate of spread, the sequence of cluster formation and the widespread dispersal experienced in the early phase of this epidemic. These results can inform outbreak control planning by guiding the imposition of appropriate control zone diameters around infected premises and the targeting of surveillance and interventions.
Copyright © 2012 Elsevier B.V. All rights reserved.
Figures


Similar articles
-
The importance of location in contact networks: Describing early epidemic spread using spatial social network analysis.Prev Vet Med. 2011 Dec 1;102(3):185-95. doi: 10.1016/j.prevetmed.2011.07.006. Epub 2011 Aug 17. Prev Vet Med. 2011. PMID: 21852007
-
A case-control study of risk factors for equine influenza spread onto horse premises during the 2007 epidemic in Australia.Prev Vet Med. 2011 Jun 1;100(1):53-63. doi: 10.1016/j.prevetmed.2011.03.002. Epub 2011 Apr 8. Prev Vet Med. 2011. PMID: 21481961
-
The influence of meteorology on the spread of influenza: survival analysis of an equine influenza (A/H3N8) outbreak.PLoS One. 2012;7(4):e35284. doi: 10.1371/journal.pone.0035284. Epub 2012 Apr 20. PLoS One. 2012. PMID: 22536366 Free PMC article.
-
Equine influenza: a review of an unpredictable virus.Vet J. 2011 Jul;189(1):7-14. doi: 10.1016/j.tvjl.2010.06.026. Epub 2010 Aug 3. Vet J. 2011. PMID: 20685140 Review.
-
A Brief Introduction to Equine Influenza and Equine Influenza Viruses.Methods Mol Biol. 2020;2123:355-360. doi: 10.1007/978-1-0716-0346-8_26. Methods Mol Biol. 2020. PMID: 32170701 Review.
Cited by
-
Social structure defines spatial transmission of African swine fever in wild boar.J R Soc Interface. 2021 Jan;18(174):20200761. doi: 10.1098/rsif.2020.0761. Epub 2021 Jan 20. J R Soc Interface. 2021. PMID: 33468025 Free PMC article.
-
Effects of Spatial Characteristics on the Spread of the Highly Pathogenic Avian Influenza (HPAI) in Korea.Int J Environ Res Public Health. 2021 Apr 13;18(8):4081. doi: 10.3390/ijerph18084081. Int J Environ Res Public Health. 2021. PMID: 33924349 Free PMC article.
-
Spatial and temporal epidemiological analysis in the Big Data era.Prev Vet Med. 2015 Nov 1;122(1-2):213-20. doi: 10.1016/j.prevetmed.2015.05.012. Epub 2015 Jun 6. Prev Vet Med. 2015. PMID: 26092722 Free PMC article. Review.
-
Coupling spatial statistics with social network analysis to estimate distinct risk areas of disease circulation to improve risk-based surveillance.Transbound Emerg Dis. 2022 Sep;69(5):e2757-e2768. doi: 10.1111/tbed.14627. Epub 2022 Jun 25. Transbound Emerg Dis. 2022. PMID: 35694801 Free PMC article.
-
VetCompass Australia: A National Big Data Collection System for Veterinary Science.Animals (Basel). 2017 Sep 26;7(10):74. doi: 10.3390/ani7100074. Animals (Basel). 2017. PMID: 28954419 Free PMC article.
References
-
- Anderson R.M., May R.M. Oxford University Press; Oxford: 1991. Infectious Diseases of Humans: Dynamics and Control.
-
- Bean B., Moore B.M., Sterner B., Peterson L.R., Gerding D.N., Balfour H.H. Survival of influenza viruses on environmental surfaces. J. Infect. Dis. 1982;146:47–51. - PubMed
-
- Callaway D.S., Newman M.E.J., Strogatz S.H., Watts D.J. Network robustness and fragility: percolation on random graphs. Phys. Rev. Lett. 2000;85:5468–5471. - PubMed
-
- Callinan, I., 2008. Equine influenza – the August 2007 outbreak in Australia. Report of the Equine Influenza Inquiry. The Hon. Ian Callinan AC.
-
- Christley R.M., French N.P. Small-world topology of UK racing: the potential for rapid spread of infectious agents. Equine Vet. J. 2003;35:586–589. - PubMed
Publication types
MeSH terms
LinkOut - more resources
Full Text Sources
