

Moderating effects of music on resting state networks
- PMID: 22365746
- PMCID: PMC3307876
- DOI: 10.1016/j.brainres.2012.01.064
Moderating effects of music on resting state networks
Abstract
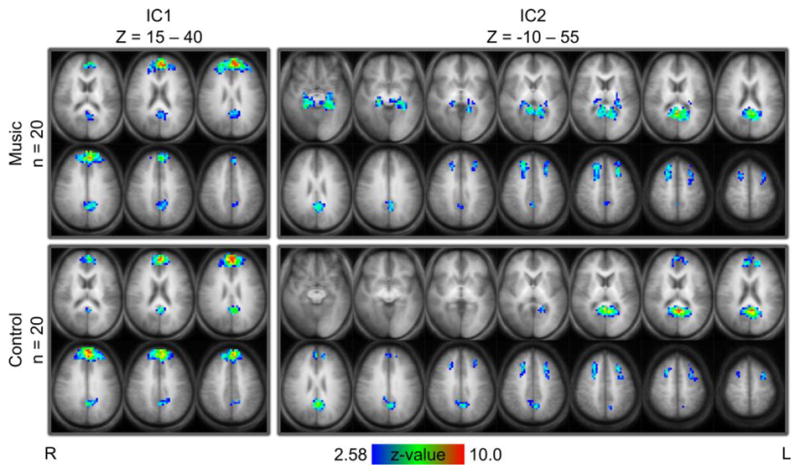
Resting state networks (RSNs) are spontaneous, synchronous, low-frequency oscillations observed in the brains of subjects who are awake but at rest. A particular RSN called the default mode network (DMN) has been shown to exhibit changes associated with neurological disorders such as temporal lobe epilepsy or Alzheimer's disease. Previous studies have also found that differing experimental conditions such as eyes-open versus eyes-closed can produce measurable changes in the DMN. These condition-associated changes have the potential of confounding the measurements of changes in RSNs related to or caused by disease state(s). In this study, we use fMRI measurements of resting-state connectivity paired with EEG measurements of alpha rhythm and employ independent component analysis, undirected graphs of partial spectral coherence, and spatiotemporal regression to investigate the effect of music-listening on RSNs and the DMN in particular. We observed similar patterns of DMN connectivity in subjects who were listening to music compared with those who were not, with a trend toward a more introspective pattern of resting-state connectivity during music-listening. We conclude that music-listening is a valid condition under which the DMN can be studied.
Copyright © 2012 Elsevier B.V. All rights reserved.
Figures
Similar articles
-
Brain-wide mapping of resting-state networks in mice using high-frame rate functional ultrasound.Neuroimage. 2023 Oct 1;279:120297. doi: 10.1016/j.neuroimage.2023.120297. Epub 2023 Jul 26. Neuroimage. 2023. PMID: 37500027
-
Slow EEG pattern predicts reduced intrinsic functional connectivity in the default mode network: an inter-subject analysis.Neuroimage. 2010 Oct 15;53(1):239-46. doi: 10.1016/j.neuroimage.2010.06.002. Epub 2010 Jun 9. Neuroimage. 2010. PMID: 20538065
-
Diminished large-scale functional brain networks in absolute pitch during the perception of naturalistic music and audiobooks.Neuroimage. 2020 Aug 1;216:116513. doi: 10.1016/j.neuroimage.2019.116513. Epub 2019 Dec 31. Neuroimage. 2020. PMID: 31901419
-
Mapping cognitive and emotional networks in neurosurgical patients using resting-state functional magnetic resonance imaging.Neurosurg Focus. 2020 Feb 1;48(2):E9. doi: 10.3171/2019.11.FOCUS19773. Neurosurg Focus. 2020. PMID: 32006946 Free PMC article. Review.
-
Resting-state network alterations in depression: a comprehensive meta-analysis of functional connectivity.Psychol Med. 2025 Feb 26;55:e63. doi: 10.1017/S0033291725000303. Psychol Med. 2025. PMID: 40008424 Free PMC article.
Cited by
-
Age related-changes in the neural basis of self-generation in verbal paired associate learning.Neuroimage Clin. 2015 Feb 20;7:537-46. doi: 10.1016/j.nicl.2015.02.006. eCollection 2015. Neuroimage Clin. 2015. PMID: 25844310 Free PMC article.
-
Connectivity patterns during music listening: Evidence for action-based processing in musicians.Hum Brain Mapp. 2017 Jun;38(6):2955-2970. doi: 10.1002/hbm.23565. Epub 2017 Mar 28. Hum Brain Mapp. 2017. PMID: 28349620 Free PMC article.
-
Reduced default mode network connectivity in treatment-resistant idiopathic generalized epilepsy.Epilepsia. 2013 Mar;54(3):461-70. doi: 10.1111/epi.12057. Epub 2013 Jan 7. Epilepsia. 2013. PMID: 23293853 Free PMC article.
-
Resting-State Connectivity of Auditory and Reward Systems in Alzheimer's Disease and Mild Cognitive Impairment.Front Hum Neurosci. 2020 Jul 17;14:280. doi: 10.3389/fnhum.2020.00280. eCollection 2020. Front Hum Neurosci. 2020. PMID: 32765244 Free PMC article.
-
Intrinsic network activity reflects the ongoing experience of chronic pain.Sci Rep. 2021 Nov 8;11(1):21870. doi: 10.1038/s41598-021-01340-0. Sci Rep. 2021. PMID: 34750460 Free PMC article.
References
-
- Allen PJ, Josephs O, Turner R. A method for removing imaging artifact from continuous EEG recorded during functional MRI. Neuroimage. 2000;12(2):230–239. - PubMed
-
- Andersson JLR, Jenkinson M, Smith S. Non-linear optimisation. FMRIB technical report TR07JA1. 2007 from www.fmrib.ox.ac.uk/analysis/techrep.
-
- Andersson JLR, Jenkinson M, Smith S. Non-linear registration, aka Spatial normalisation FMRIB technical report TR07JA2. 2007 from www.fmrib.ox.ac.uk/analysis/techrep.
Publication types
MeSH terms
Grants and funding
LinkOut - more resources
Full Text Sources
