. 2012 Feb 24;45(4):483-93.
doi: 10.1016/j.molcel.2011.11.035.

Cellular noise regulons underlie fluctuations in Saccharomyces cerevisiae

Affiliations

Cellular noise regulons underlie fluctuations in Saccharomyces cerevisiae

Jacob Stewart-Ornstein et al. Mol Cell. .

Abstract

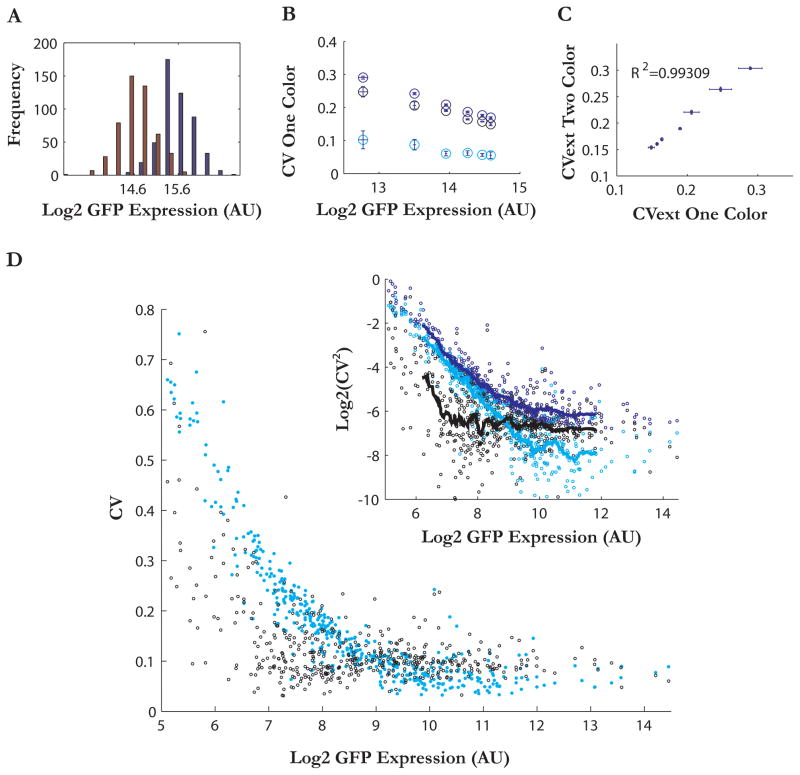
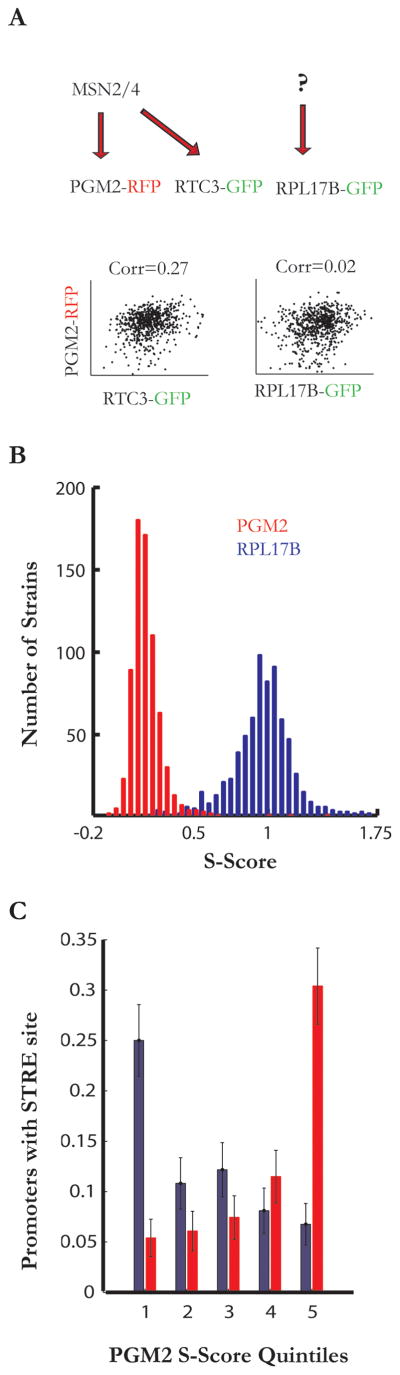
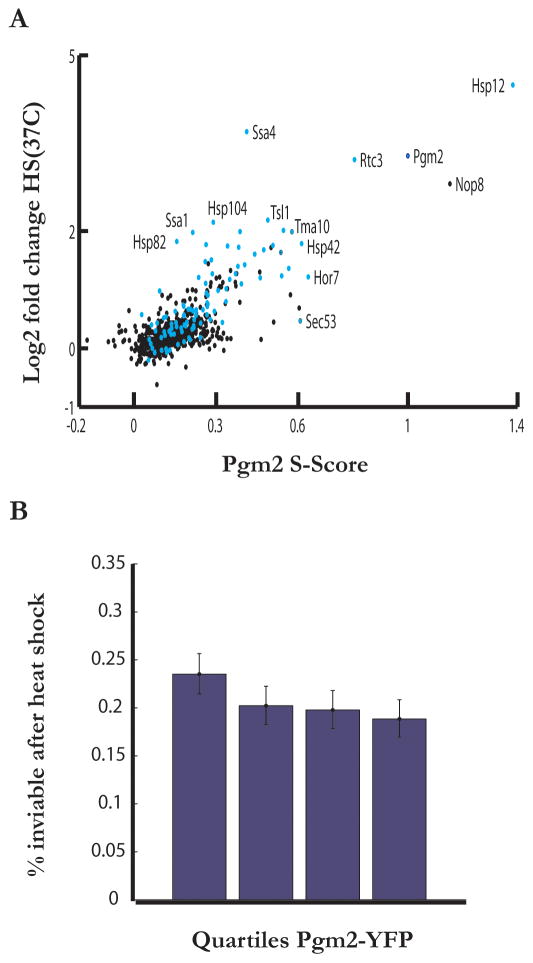
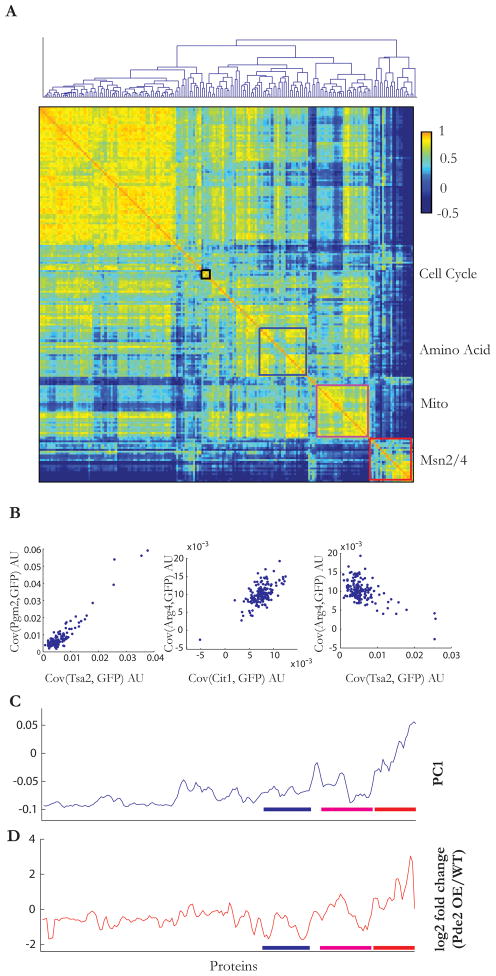
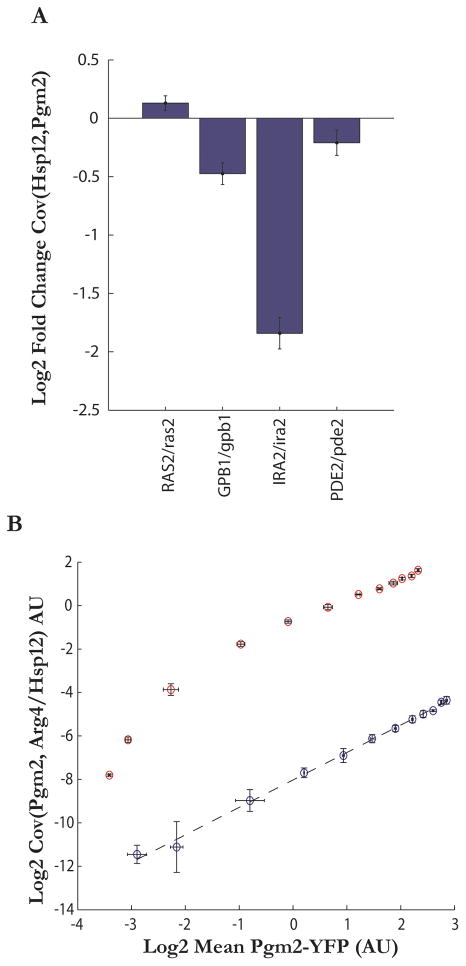
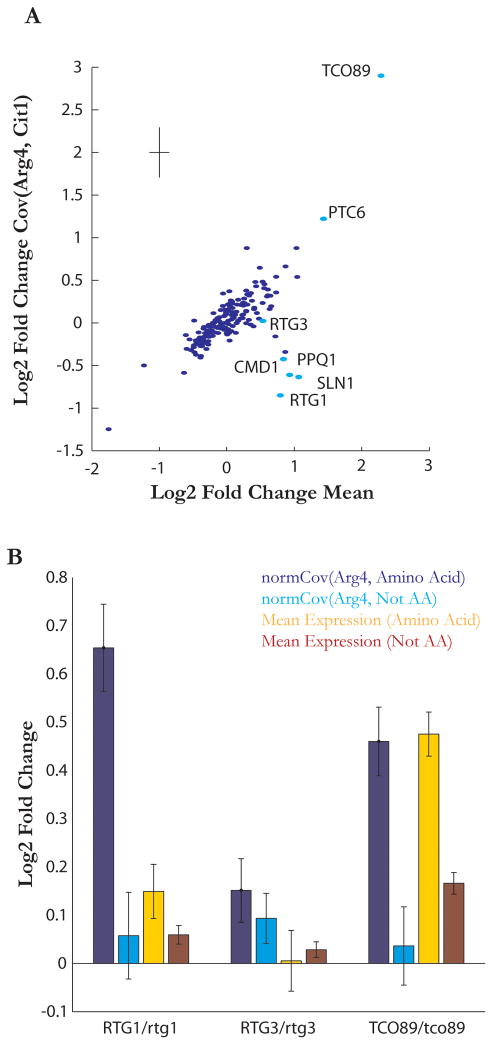
Stochasticity is a hallmark of cellular processes, and different classes of genes show large differences in their cell-to-cell variability (noise). To decipher the sources and consequences of this noise, we systematically measured pairwise correlations between large numbers of genes, including those with high variability. We find that there is substantial pathway variability shared across similarly regulated genes. This induces quantitative correlations in the expression of functionally related genes such as those involved in the Msn2/4 stress response pathway, amino-acid biosynthesis, and mitochondrial maintenance. Bioinformatic analyses and genetic perturbations suggest that fluctuations in PKA and Tor signaling contribute to pathway-specific variability. Our results argue that a limited number of well-delineated "noise regulons" operate across a yeast cell and that such coordinated fluctuations enable a stochastic but coherent induction of functionally related genes. Finally, we show that pathway noise is a quantitative tool for exploring pathway features and regulatory relationships in un-stimulated systems.


Figures

Figure 1
Figure 1. Extrinsic versus intrinsic noise decomposition across the proteome
(a) Histograms of the single cell fluorescence of populations of cells expressing either one (red) or two (blue) copies of pGal1-YFP. The mean of the two distributions are separated by one log2 unit. (b) Total, intrinsic, and extrinsic noise plotted against log mean expression for seven levels of induction of pGal1-YFP. Noise was quantified as the Coefficient of Variation (CV=σ/μ) of the YFP distribution. (c) Comparison of extrinsic noise values calculated using a two color (pGal1-YFP, pGal1-mCherry) or one color approach. (d) Intrinsic (cyan) and extrinsic(black) noise plotted against log2 mean expression for 465 genes. Inset: log2(CV2) plotted against log2(mean), running means (smoothing window of 30) for intrinsic(cyan), extrinsic(black), total (dark blue) noise.
Figure 2
Figure 2. Stress genes inherit fluctuations from the transcription factors Msn2/4
(a) Schematic illustration of correlation analysis of GFP-tagged and RFP-tagged proteins expressed within a single cell. Proteins encoded by genes regulated by the same upstream factor (the transcription factor Msn2/4) show strong correlation while proteins regulated by unrelated processes show weak correlation. (b) Histograms of the Pgm2 (red) and Rpl17B (blue) S-scores for 750 of the most abundant protein in the S. cerevisiae GFP collection. (c) Percent genes with one or more STRE elements in their promoters (700 bp before the start codon) versus quintiles of Pgm2 or Rpl17B S-score, error bars show standard error based on a binomial model.
Figure 3
Figure 3. Fluctuations in Msn2/4 target genes are predictive of response to stress
(a) Plot of the fold induction of a gene following heat shock against its Pgm2 S-value for assayed genes. Genes with two or more Msn2 binding sites (‘AGGGG’) in the 700bp before their start codon are colored blue. (b) Survival of cells as a function of their basal Pgm2 levels. Pgm2-YFP expression was determined for individual cells in mid-exponential phase (OD=0.5). Cells were then heat shocked (50C, 20 min), and stained with propidium iodide to detect dead cells. The probability of cell death was lower (18.84% (95% CI = 16.96–20.84)) in the top 25% of Pgm2 expressing cells compared to the bottom quarter (23.51% (95% CI = 21.45–25.66%)). Statistics were computed using a binomial test (N=1608 in each quartile, error bars show 95% CI).
Figure 4
Figure 4. Noise measurements divide the genome into distinct regulons and inform an understanding of the dimensionality of a cell
(a) A map of noise correlations among 182 proteins showing distinct blocks that share patterns of covariance. Prominent among these are Amino Acid biosynthesis (magenta outline), Mitochondrial (blue outline), and Stress responsive (red outline) clusters. A smaller group of cell cycle regulated genes are also apparent (black). (b) Scatter plots comparing the covariances of Pgm2, Tsa2, Arg4, and Cit1 with the 182 proteins show similar covariance patterns for two members of the same stress responsive cluster (Pgm2, Tsa2), anti-correlated patterns for two members (Arg4 and Tsa2) of distinct cluster, and the presence of ‘off-diagonal’ interactions between different clusters (Cit1 and Arg4). (c) A principal component analysis of the covariance dataset shows that five principle components (PCs) can describe ~80% of the observed variance. Contribution of the noise in different genes to the first PC, PC1, is plotted in the order in which they appear in (a). Values are smoothed using a sliding window of size 3. (d) Expression of 184 GFP-tagged proteins in a Pde2 over-expression background. The results are reported as a log2 of the ratio of GFP in the overexpression strain normalized to that of the wild-type. Overexpression of Pde2 was achieved using an estradiol inducible GAL1 promoter. Proteins are in the order in which they appear in (a). Induction values were smoothed with a sliding window of size 3.
Figure 5
Figure 5. Genetic perturbations tie the Msn2/4 noise regulon to PKA signaling and demonstrate that mean expression of a pathway and covariance within a pathway have a complex relationship
(a) Noise-induced covariance between Hsp12-RFP and Pgm2-YFP is altered in heterozygous deletes of PKA pathway members, showing significant decreases in PDE2/pde2, IRA2/ira2, and GBP1/gbp1 strains and an increase in the RAS2/ras2 strain. Error bars represent standard error of means (n=6) (b) Covariance of Pgm2 and Arg4 as a function of mean Pgm2 expression as the levels of Msn2 are varied. Overexpression of constitutively active Msn2 to various levels results in a log-linear increase in covariance between Arg4 and Pgm2 as a function of Pgm2, and non-loglinear increase in covariance between Pgm2 and Hsp12, two proteins whose genes promoters are targets of Msn2. Error bars represent standard error of means (n=3).
Figure 6
Figure 6. Covariance measurements of heterozygous strains link noise in amino acid biosynthesis to Tor signaling
(a) Covariance of the amino acid biosynthesis protein Arg4-mCherry and the mitrochondrial protein Cit1-GFP plotted against the geometric mean of Arg4-mcherry and Cit1-GFP for 188 heterozygous deletion mutants. Values are displayed as log2 fold change over WT. Strains referred to in the text are highlighted in cyan. Error bars in upper left show standard deviation of replicate measurements. (b) Change of Arg4 mean and covariance between Arg4 and members in the amino acid biosynthesis group in RTG1/rtg1, RTG3/rtg3, and TCO89/tco89 heterozygous strains. Values are displayed as log2 fold change over WT. RTG1/rtg1 and TCO89/tco89 heterozygous deletions cause significant increases in covariance, while RTG3/rtg3 has no significant effect on the covariance. TCO89/tco89 heterozygous deletion, but not RTG1/rtg1 heterozygous deletion, increases mean gene expression of amino acid biosynthesis genes. Error bars represent standard error of means.

Comment in

References

    1. Becskei A, Kaufmann BB, Oudenaarden A. Contributions of low molecular number and chromosomal positioning to stochastic gene expression. Nature Genetics. 2005;37:937–944. - PubMed
    1. Bigger W. Treatment Of Staphylococcal Infections With Penicillin by Intermittent Sterilisation. The Lancet. 1944;244(6320):497–500.
    1. Blake WJ, Kaern M, Cantor CR, Collins JJ. Noise in eukaryotic gene expression. Nature. 2003;422:633–637. - PubMed
    1. Blake WJ, Balazsi G, Kohanski MA, Isaacs FJ, Murphy KF, Kuang Y, Cantor CR, Walt DR, Collins JJ. Phenotypic consequences of promoter-mediated transcriptional noise. Molecular Cell. 2006;24:853–865. - PubMed
    1. Burnett JC, Miller-Jensen K, Shah PS, Arkin AP, Schaffer DV. Control of Stochastic Gene Expression by Host Factors at the HIV Promoter. PLoS Pathog. 2009;5(1):e1000260. doi: 10.1371/journal.ppat.1000260. - DOI - PMC - PubMed

Publication types

MeSH terms

Substances

LinkOut - more resources