. 2012 Apr;11(4):494-506.
doi: 10.1128/EC.05296-11. Epub 2012 Feb 24.

Role of ATG8 and autophagy in programmed nuclear degradation in Tetrahymena thermophila

Affiliations

Role of ATG8 and autophagy in programmed nuclear degradation in Tetrahymena thermophila

Ming-Liang Liu et al. Eukaryot Cell. 2012 Apr.

Abstract

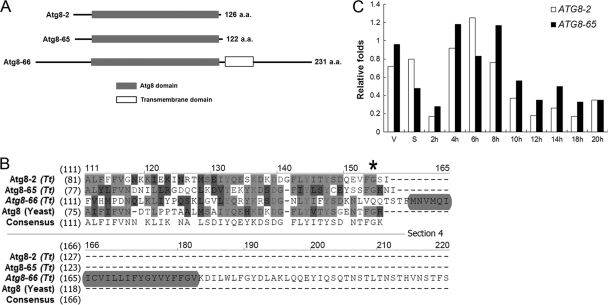
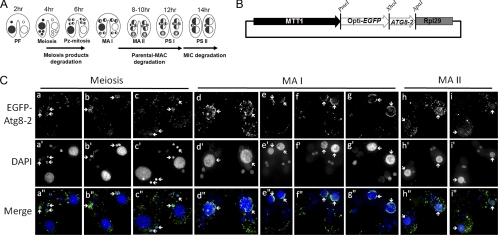
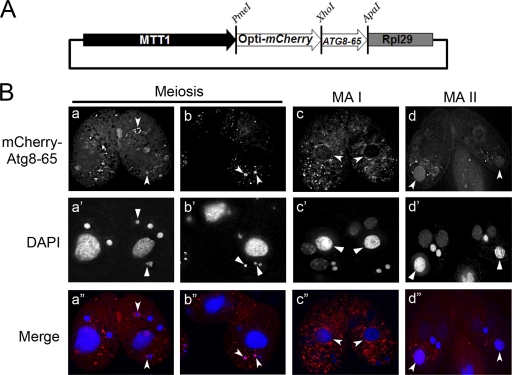
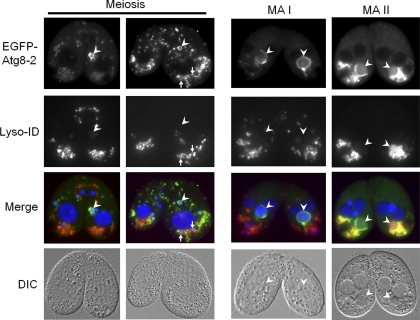
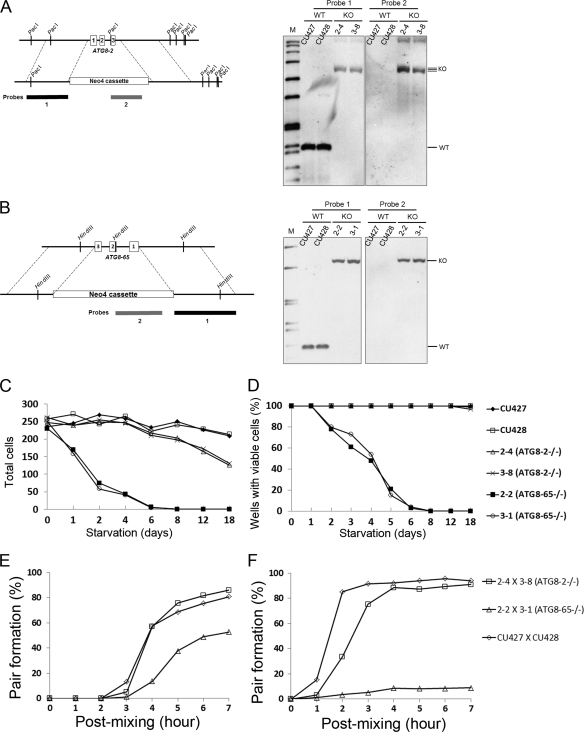
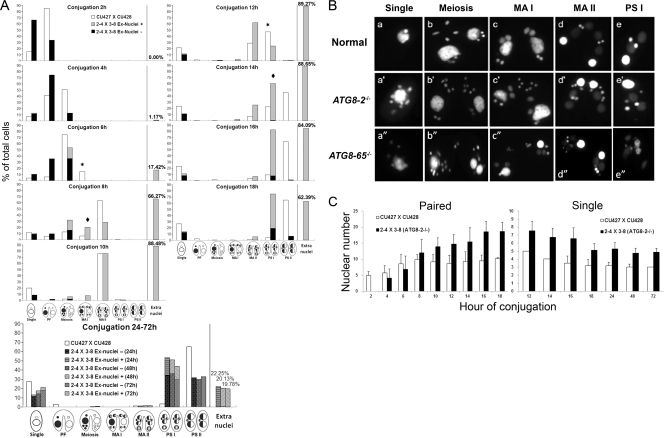
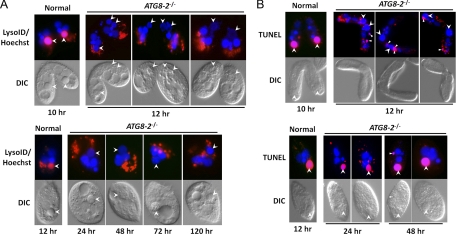
Autophagy is an evolutionarily conserved mechanism for the degradation of cellular components, but its role in enucleation during differentiation has not been established. Tetrahymena thermophila is a unicellular eukaryote with two functionally distinct nuclei, the somatic (macro-) and the germ line (micro-) nuclei. These nuclei are produced during sexual reproduction (conjugation), which involves differentiation and selective degradation of several specific nuclei. To examine the role of autophagy in nuclear degradation, we studied the function of two ATG8 genes in Tetrahymena. Through fluorescent protein tagging, we found that both proteins are targeted to degrading nuclei at specific stages, with some enrichment on the nuclear periphery, suggesting the formation of autophagosomes surrounding these nuclei. In addition, ATG8 knockout mutant cells showed a pronounced delay in nuclear degradation without apparently preventing the completion of other developmental events. This evidence provided direct support for a critical role for autophagy in programmed nuclear degradation. The results also showed differential roles for two ATG8 genes, with ATG8-65 playing a more significant role in starvation than ATG8-2, although both are important in nuclear degradation.


Figures

Fig 1
Fig 1
Characterization of Atg8ps in Tetrahymena. (A) Schematic representation of Atg8 proteins. Black solid lines show the full lengths of the Atg8 proteins. (B) Multiple-sequence alignment of the C-terminal region of Tetrahymena Atg8 proteins. The asterisk indicates the position of the conserved C-terminal glycine residue. Light gray, conservative or identical amino acids; dark gray, similar amino acids; light gray rectangle, the transmembrane domain of theAtg8-66 protein. (C) Quantitative RT-PCR findings for ATG8 mRNA expression levels. Total RNA samples isolated from vegetative (V), starved (S), and conjugating cells (2, 4, 6, 8, 10, 12, 14, 16, 18, and 20 h after postmixing) were used as templates. Quantification was normalized by using α-tubulin mRNA.
Fig 2
Fig 2
EGFP–Atg8-2p locates to degenerating nuclei during conjugation. (A) Developmental process and nuclear degradation events of Tetrahymena during conjugation. PF, pair formation; Pz-mitosis, postzygotic mitosis; MA I, macronuclear anlagen I; MA II, macronuclear anlagen II; PS I, pair separation I; PS II, pair separation II. The indicated times (hours of conjugation) show the approximate time period after mixing different mating type cells. (B) Schematic representation of the employed EGFP–ATG8-2 overexpression vector. MTT1, the promoter of the Cd2+-inducible metallothionein (MTT1) gene; opti-EGFP, Tetrahymena codon-optimized enhanced GFP; ATG8-2, Tetrahymena ATG8-2 gene; RPL29, terminator of the 60S ribosomal protein gene L29. (C) Localization of EGFP–Atg8-2ps in mating cells at different conjugation stages. EGFP–Atg8-2-overexpressing mating cells were fixed in 2% paraformaldehyde at 2-hour intervals. Cellular nuclei were stained with DAPI (40 ng/ml), and subsequently, fixed cells were classified into different stages according to cellular and nuclear morphologies. Fluorescent images were taken with a DeltaVision deconvolution microscope. Arrows, location of EGFP–Atg8-2–positive nuclei.
Fig 3
Fig 3
mCherry–Atg8-65p is localized to degenerating nuclei during conjugation. (A) Schematic representation of the mCherry–ATG8-65 overexpression vector. (B) Localization of mCherry–Atg8-65ps in mating cells at different conjugation stages. The sample processing was the same as for samples shown in Fig. 2C, and images were taken with a DeltaVision deconvolution microscope.
Fig 4
Fig 4
EGFP–Atg8-2p labeling of the parental macronucleus occurs before nuclear acidification and condensation. The images show localization of EGFP–Atg8-2ps in mating cells at different conjugation stages, based on Lyso-ID Red dye staining. EGFP–Atg8-2p expression was induced when starved cells of different mating types were mixed. Live pairing cells were stained with Lyso-ID Red dye for acidified structures and Hoechst for DNA at conjugation, from 4 to 9 hours. Images were taken by using a conventional fluorescence microscope with differential interference contrast (DIC). Arrows, meiotic products with EGFP and Lyso-ID Red dye staining; arrowheads, nuclei with EGFP staining.
Fig 5
Fig 5
The ATG8-65 homozygous knockout was sensitive to starvation. (A, left) Schematic showing the ATG8-2 genomic locus before (upper) or after (lower) homologous recombination with the neo4 knockout cassette. Numbered boxes represent three exons. Probe 1 (1,093 bp) was used to detect the insertion accuracy of the knockout cassette. Probe 2 (0.7 kb) was used to ensure the existence of the neo knockout cassette. (Right) Southern analysis of PacI-digested genomic DNA isolated from ATG8-2/ (2-4 and 3-8) or wild-type (CU427 and CU428) strains. KO (knockout) bands, 4.5 kb; WT (wild-type) bands, 1.5 kb; M (marker), DIG labeling marker. (B, left) Schematic showing the ATG8-65 genomic locus before (upper) and after (lower) knockout cassette replacement. The representation of numbered boxes and functions of probe 1 (1,055 bp) and probe 2 (0.7 kb) are the same as for panel A. (Right) Southern analysis of HindIII-digested genomic DNA from ATG8-65/ (2-2 and 3-1) or WT strains. KO bands, 3.1 kb; WT bands, 1.1 kb; M, DIG labeling marker. (C) Remaining cells in ATG8 knockout or wild-type starvation pools. Cells starved in 10 mM Tris buffer for 0, 1, 2, 4, 6, 8, 12, and 18 days were sampled (200 μl) from starvation pools and fixed in 2% paraformaldehyde. Total cell numbers represent the averages of three independent samples taken from the same starvation pool. (D) Percentages of wells with viable cells in a 96-well plate seeded with starved ATG8 knockout or wild-type cells. A 25-μl aliquot of starved cells (containing an average of 30 input cells at the beginning of starvation) was sampled from the same starvation pools and at the same time point as shown in panel C and transferred to 96-well plates with rich SPP medium (50 μl) for incubation at 30°C. Three days later, wells were examined for the presence of viable cells. Percentages represent averages from three 96-well plates. Panels C and D share the same labeling as that shown at the right side of panel D. (E and F) Mating ability of ATG8 knockout and wild-type starved cells. Vegetative cells grown in Neff medium were directly diluted with Tris buffer to generate a 10-fold-diluted Neff solution for starvation. Cells of different mating types were either mixed immediately after dilution (E) or later after overnight prestarvation (F). Cells were fixed at 0, 1, 2, 3, 4, 5, 6, and 7 h postmixing to calculate the pairing rate. Panels E and F share the same labeling as shown at the right side of panel F. Percentages represent the average values of three independent samples from two individual experiments.
Fig 6
Fig 6
ATG8 complete knockout cells carried the extra nuclei phenotype caused by delayed nuclear degradation. (A) Mating progression of ATG8-2 knockout or wild-type mating cells. Mating cells at 2, 4, 6, 8, 10, 12, 14, 24, 48, and 72 h after conjugation were fixed in 2% paraformaldehyde and treated with DAPI (40 ng/ml) for staining of nuclei. Cells were classified into different stages according to cellular and nuclear morphologies. The compositions of cells with regard to different developmental stages at each examined conjugation time point are shown. Percentages represent the average values of three independent samples. White bars, wild type; black bars, mutant with normal nuclear number; gray bars, mutant with extra nuclei; asterisks, wild type; rhombuses, ATG8-2 knockout. Time intervals indicate the time period of new MAC development. (B) Nuclear morphology of wild-type and ATG8 knockout mating cells with aberrant nuclear configurations at different stages. Images were taken with a conventional fluorescence microscope. Single, single cells, including nonmating cells and pairs that have separated. (C) Nuclear numbers of pairing cells or single separated progeny sampled at the indicated time points. Percentages represent the average values of three independent samples from two individual experiments.
Fig 7
Fig 7
Degenerating nuclei of ATG8-2 knockout cells showed DNA damage but no acidification. (A) Lyso-ID Red dye staining of ATG8-2 knockout mating cells. Living mating cells at 10 and 12 h (wild type) or at 12, 24, 48, 72, and 120 h (knockout) of conjugation were stained with Lyso-ID Red dye for acidified structures and Hoechst for nuclei. (B) TUNEL assay results of ATG8-2 knockout mating cells. Mating cells after conjugation for 10 and 12 h (wild type) or at 12, 24, and 48 h (knockout) after conjugation were fixed in 2% paraformaldehyde and then incubated with a TdT (terminal deoxynucleotidyl transferase) mixture solution (Roche Applied Science, Indianapolis, IN) after permeabilization. Images were taken by using a conventional fluorescence microscope. Arrowheads, old macronuclei; triangles, degrading meiotic products.

Similar articles

Cited by

References

    1. Akematsu T, Endoh H. 2010. Role of apoptosis-inducing factor (AIF) in programmed nuclear death during conjugation in Tetrahymena thermophila. BMC Cell Biol. 11:13. - PMC - PubMed
    1. Akematsu T, Pearlman RE, Endoh H. 2010. Gigantic macroautophagy in programmed nuclear death of Tetrahymena thermophila. Autophagy 6:901–911 - PMC - PubMed
    1. Allewell NM, Oles J, Wolfe J. 1976. A physicochemical analysis of conjugation in Tetrahymena pyriformis. Exp. Cell Res. 97:394–405 - PubMed
    1. Alvarez VE, et al. 2008. Autophagy is involved in nutritional stress response and differentiation in Trypanosoma cruzi. J. Biol. Chem. 283:3454–3464 - PubMed
    1. Benchimol M. 1999. Hydrogenosome autophagy: an ultrastructural and cytochemical study. Biol. Cell 91:165–174 - PubMed

Publication types

MeSH terms

LinkOut - more resources