. 2012 Feb;24(2):374-94.
doi: 10.1105/tpc.111.093302. Epub 2012 Feb 24.

New technologies for 21st century plant science

Affiliations

New technologies for 21st century plant science

David W Ehrhardt et al. Plant Cell. 2012 Feb.

Abstract

Plants are one of the most fascinating and important groups of organisms living on Earth. They serve as the conduit of energy into the biosphere, provide food, and shape our environment. If we want to make headway in understanding how these essential organisms function and build the foundation for a more sustainable future, then we need to apply the most advanced technologies available to the study of plant life. In 2009, a committee of the National Academy highlighted the "understanding of plant growth" as one of the big challenges for society and part of a new era which they termed "new biology." The aim of this article is to identify how new technologies can and will transform plant science to address the challenges of new biology. We assess where we stand today regarding current technologies, with an emphasis on molecular and imaging technologies, and we try to address questions about where we may go in the future and whether we can get an idea of what is at and beyond the horizon.


Figures

Figure 1.
Figure 1.
Trajectory of Cost Reductions in DNA Sequencing. Data replotted from: Wetterstrand K.A. For DNA sequencing costs, data are from the National Human Genome Research Institute Initiative Large-Scale Genome Sequencing Program available at www.genome.gov/sequencingcosts (accessed February 4, 2011).
Figure 2.
Figure 2.
Reversible Manipulation of Protein Function Using Targeted Illumination. Fusion proteins featuring Phytochrome and its effector phytochrome interacting factor3 (PIF) allow for reversible control of protein recruitment to the plasma membrane at the spatial precision of optical resolution and on a time scale of seconds. Levskaya et al. (2009) showed that these tools could be used to manipulate cell shape by locally activating Rho-GTPase signaling through light-mediated recruitment of Rho effector proteins to the plasma membrane of mammalian cells. A fusion protein of cyan fluorescent protein (CFP) and Phytochrome B (PHY) is tethered to the plasma membrane, where activation by red light recruits phytochrome interacting factor3 fused to yellow fluorescent protein (YFP) and the catalytic domain of the RacGEF Tiam (ITSN DHPH). The concentration of the RacGEF domain at the membrane activates its target Rho GTPase Cdc42, which in turn recruits a sensor consisting of the GBD binding domain of the actin polymerization factor WASP fused to the mCherry fluorescent protein. (Reprinted by permission from Macmillan Publishers Ltd.: Nature [Levskaya et al., 2009; Figure 4], copyright 2009.)
Figure 3.
Figure 3.
Rapid 3D Time-Lapse Imaging. Maximum projections made from spinning disk confocal stacks acquired from Arabidopsis leaf epidermal cells expressing GFP:a-tubulin 6 to label cortical microtubules. The images show the junction between two pavement cells. Twenty-five confocal sections were acquired every 5 s to generate 3D volumes ~7 μm in depth. (Image courtesy of D.W. Ehrhardt and Y. Fu, unpublished data.)
Figure 4.
Figure 4.
Light Sheet–Based Imaging of Arabidopsis Seedlings. (A) View of the central components of a digital scanned laser light sheet fluorescence microscope. The illumination system excites the fluorophores in a thin planar volume by rapidly scanning a micrometer-wide Gaussian laser beam inside the specimen. Fluorescence is collected at right angles to the illuminated plane by the detection system. The planar excitation volume and the focal plane of the detection system overlap. The intensity of the laser beam can be modulated in synchrony with the scanning process (SI). (Left figure by P. Theer.) (B) Close-up of the sample chamber (boxed region in [A]). The root of the plant is growing on the surface of a Phytagel cylinder immersed in culture medium (half-strength Murashige and Skoog medium), while its leaves are in the air. The chamber is equipped with a perfusion system exchanging the whole chamber volume every 15 min and a sun-like lighting system covering the plant leaves from above. (C) Side view of the two types of sample holder used for imaging. (Left) The root of the plant grows into a 0.5% Phytagel cylinder. For the image acquisition process, the Phytagel cylinder is extruded from the capillary, which is rigidified by an embedded carbon rod. (Right) The root grows through a plastic cone filled with 0.5% Phytagel maintained by a ring holder. In both designs, 2-d-old seedlings were transferred to the holders and further cultured in a tilted position such that the root grew toward the glass until the onset of imaging into the chambers indicated below. (Reprinted with permission from John Wiley and Sons, Ltd.: Plant Journal [Maizel et al., 2011; Figure 1], copyright 2011.)
Figure 5.
Figure 5.
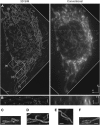
3D Super-Resolution Imaging of a Live Cell by SI Microscopy. Maximum projection (A) and xz section (B) of a Hela cell stained with MitoTracker Green to label the mitochondria cell, as acquired with a 3D SI microscope. Images acquired with conventional epifluorescence are shown at left. Details of the SIM image are shown in (C) to (F). [Reprinted by permission from Macmillan Publishers Ltd.: Nature Methods [Shao et al., 2011; Figure 2], copyright 2011.)
Figure 6.
Figure 6.
3D Super-Resolution Imaging of Plasmodesmata. Simple and branched plasmodesmata viewed with confocal, wide-field, and 3D-SIM imaging. (A) Conventional confocal image showing plasmodesmata containing MP-GFP (green) labeled with callose antibody (Alexa 594; red). Overlapping signals appear yellow (arrows), but individual plasmodesmata are not resolved. Bar = 5 μm. (B) to (G) 3D-SIM images of simple plasmodesmata. (B) Diagram of a single plasmodesmata pore, showing callose collars (red) separated from a single central cavity (green). (C) to (G) 3D-SIM spatially resolves the callose collars of individual plasmodesmata from the central cavity. The corresponding wide-field images of the same pores pictured in (D) and (F) are shown in (E) and (G), respectively. A Y-shaped plasmodesmata configuration is shown in (D). An extension of the central cavity is seen in ([F]; arrowhead). W, Cell wall. Bars = 1 μm. (H) A z series taken using 3D-SIM of a single plasmodesmata pore. The individual images are 125 nm apart. Note that two pores can be seen (arrows), each leading to a shared central cavity (arrowhead). Bar = 1 μm. (Reprinted with permission from Fitzgibbon et al. [2010], Figure 1.)
Figure 7.
Figure 7.
OPT. (A) OPT volume view of the first true leaves of an Arabidopsis seedling showing trichome cells on the adaxial leaf surface (cotyledons removed). The image was taken with fluorescence OPT (GFP1 filter). Bar = 285 μm. (B) Part of an Arabidopsis silique imaged by fluorescence OPT (Texas Red filter). Bar = 42 μm. (C) Clipping of an OPT volume of an Arabidopsis seedling to display vasculature. Vasculature is more autofluorescent than the surrounding tissue, making it appear brighter. Bar = 100 μm. (D) An Arabidopsis silique (from [B]) clipped to reveal internal structure. A piece was removed using three clipping planes to show the seeds developing within. The removed piece is shown at left. Individual seeds were also dissected out using six clipping planes to display the heart-stage embryo (arrowhead) and endosperm within (two examples shown at right). Bar = 35 μm. (Reprinted with permission from Lee et al. [2006], Figures 1 and 2.)

Similar articles

Cited by

References

    1. Abbondanzieri E.A., Greenleaf W.J., Shaevitz J.W., Landick R., Block S.M. (2005). Direct observation of base-pair stepping by RNA polymerase. Nature 438: 460–465 - PMC - PubMed
    1. Agapakis C.M., Niederholtmeyer H., Noche R.R., Lieberman T.D., Megason S.G., Way J.C., Silver P.A. (2011). Towards a synthetic chloroplast. PLoS ONE 6: e18877. - PMC - PubMed
    1. Alwine J.C., Kemp D.J., Stark G.R. (1977). Method for detection of specific RNAs in agarose gels by transfer to diazobenzyloxymethyl-paper and hybridization with DNA probes. Proc. Natl. Acad. Sci. USA 74: 5350–5354 - PMC - PubMed
    1. Andersson M.X., Goksor M., Sandelius A.S. (2007). Membrane contact sites: physical attachment between chloroplasts and endoplasmic reticulum revealed by optical manipulation. Plant Signal. Behav. 2: 185–187 - PMC - PubMed
    1. Andre G., Kulakauskas S., Chapot-Chartier M.P., Navet B., Deghorain M., Bernard E., Hols P., Dufrene Y.F. (2010). Imaging the nanoscale organization of peptidoglycan in living Lactococcus lactis cells. Nat. Commun. 1: 27. - PMC - PubMed

Publication types

LinkOut - more resources