. 2012 Feb 26;8(4):375-82.
doi: 10.1038/nchembio.799.

Regulation of nuclear PKA revealed by spatiotemporal manipulation of cyclic AMP

Affiliations

Regulation of nuclear PKA revealed by spatiotemporal manipulation of cyclic AMP

Vedangi Sample et al. Nat Chem Biol. .

Erratum in

  • Nat Chem Biol. 2013 Jun;9(6):406

Abstract

Understanding how specific cyclic AMP (cAMP) signals are organized and relayed to their effectors in different compartments of the cell to achieve functional specificity requires molecular tools that allow precise manipulation of cAMP in these compartments. Here we characterize a new method using bicarbonate-activatable and genetically targetable soluble adenylyl cyclase to control the location, kinetics and magnitude of the cAMP signal. Using this live-cell cAMP manipulation in conjunction with fluorescence imaging and mechanistic modeling, we uncovered the activation of a resident pool of protein kinase A (PKA) holoenzyme in the nuclei of HEK-293 cells, modifying the existing dogma of cAMP-PKA signaling in the nucleus. Furthermore, we show that phosphodiesterases and A-kinase anchoring proteins (AKAPs) are critical in shaping nuclear PKA responses. Collectively, our data suggest a new model in which AKAP-localized phosphodiesterases tune an activation threshold for nuclear PKA holoenzyme, thereby converting spatially distinct second messenger signals to temporally controlled nuclear kinase activity.


Figures
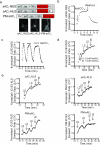
Figure 1
Figure 1. Spatiotemporal manipulation of intracellular cAMP using sAC (SMICUS) in HEK-293 cells
(a) Domain scheme of sACt-NES, sACt-NLS, and PM-sACt. RFP images of HEK-293 cells transiently transfected with the subcellularly targeted versions of sACt showing localization of sACt-NES to the cytoplasm, sACt-NLS to the nucleus and PM-sACt to the plasma-membrane. Scale bars, 10 μm. (b) Representative time course of yellow/cyan (Y/C) emission ratio changes in single HEK-293 cells expressing AKAR-NES and sACt-NES showing that sACt-NES mediated cAMP production can be reversed upon washout (n = 5). (c) Response of ICUE3-NES to repeated stimulation and washout. There is no detectable desensitization of the system. (d) The amplitude of ICUE3-NES responses can be tuned with the addition of low doses (LD) of 2.5 mM and intermediate doses (ID) of 7.5 mM NaHCO3 (n = 3). (e) Top panel: Representative response curves of ICUE3-NLS (left; n = 5) and PM-ICUE3 (right; n = 2) upon stimulation of sACt-NLS. Bottom panel: ICUE3-NLS (left; n = 3) and PM-ICUE3 (right; n = 2) with activation of PM-sACt demonstrating that SMICUS can be used to tune local cAMP signals.
Figure 2
Figure 2. Spatial manipulation of cAMP production reveals differential PKA activity dynamics in the nuclei of HEK-293 cells
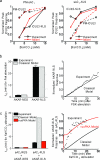
(a) Representative response curves for AKAR-NLS upon 15 mM NaHCO3 stimulation of sACt-NLS (red inverted triangle; n = 7), sACt-NES (orange triangle; n = 9) and PM-sACt (gray diamond; n = 4). (b) Comparison of t½ values reveals statistically significant differences in PKA kinetics mediated by membrane- versus cytosol/nuclear-generated cAMP. All data are presented as average ± SEM.
Figure 3
Figure 3. Rapid nuclear PKA responses to local cAMP accumulation require nuclear PKA holoenzyme
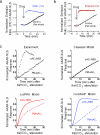
(a) Classical Model fits to local and distal ICUE responses to NaHCO3-stimulated cAMP production by membrane (left) and nuclear (right) sACs. (b) Left: Classical Model fit to AKAR responses to 50 μM Fsk in the cytosol and nucleus. Right: Time course depiction of Classical Model fit to nuclear PKA activation by 50 μM Fsk. (c) Left: Classical Model and nucPKA Model fit to local AKAR responses to local sAC stimulation by 15 mM NaHCO3. Right: Time course depictions of Classical Model and nucPKA Model fits to nuclear PKA activation by nuclear sAC stimulation. nucPKA Model differs from the Classical Model only by addition of nuclear PKA holoenzyme.
Figure 4
Figure 4. PKA holoenzyme is in the nuclei of HEK-293 cells
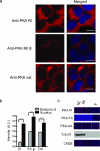
(a) Immunofluorescence staining using anti-pan RI PKA, RIIβ PKA and Cα PKA antibodies gave a detectable signal in the nuclei of HEK-293 cells. Nuclei were stained with DAPI, a blue-fluorescent nucleic acid marker. Scale bars, 10 μm. (b) A graphical representation of the intensities in Arbitrary Unit (A.U.) comparing the signal in the nuclei to the background for each antibody staining (P<0.0001 for all three) (c) Immunoblot analysis was carried out on whole cell (WC), non-nuclear (NN) and nuclear (N) fractions with anti-pan RI PKA, RIIβ PKA and Cα PKA antibodies. Probing with anti-tubulin and anti-CREB antibodies showed that the nuclear fraction was free of cytosolic proteins (see Supplementary Fig. 14 for full blots).
Figure 5
Figure 5. cAMP-PKA signaling in the nuclei of HEK-293 cells is tightly regulated by PDEs and AKAPs
(a) PDE inhibition by 100 μM IBMX accelerated AKAR-NLS kinetics upon tmAC activation by 50 μM Fsk (representative blue curve; n = 18) compared against slow nuclear PKA responses to 50 μM Fsk alone in control cells (representative grey curve; n=13). (b) Co-treatment with 10 μM Rolipram, a PDE4 specific inhibitor, and Fsk results in faster AKAR-NLS responses (representative red curve; n = 8) compared to Fsk stimulation alone (representative black curve; n = 13). (c) Simulated time course comparisons between the Classical, nucPKA and nucAKAP models for predicting slow and fast nuclear PKA responses to membrane cAMP generation and cytosolic cAMP generation, respectively (representative experimental time course depicted). (d) Classical, nucPKA and nucAKAP Model fits to compartmented PKA kinetics in response to 50 μM Fsk in the absence (left) or presence of 100 μM IBMX (right). The nucAKAP Model best captures both the slow response to 50 μM Fsk alone and the marked acceleration by IBMX addition. (e) Disruption of PKAAKAP interaction with 50 μM St-Ht31 (green curve, averaged responses (n = 14)) results in a rapid AKAR-NLS response upon Fsk stimulation while treatment with St-Ht31P (scramble control, black curve, averaged responses (n = 9)) has no effect on Fsk-stimulated AKAR-NLS response. (f) Measured nuclear AKAR t1/2s indicate PDE inhibition and AKAP disruption are both sufficient for accelerating nuclear PKA responses.

Similar articles

Cited by

References

    1. Tasken K, Aandahl EM. Localized effects of cAMP mediated by distinct routes of protein kinase A. Physiol Rev. 2004;84:137–67. - PubMed
    1. Steinberg SF, Brunton LL. Compartmentation of G protein-coupled signaling pathways in cardiac myocytes. Annual Review of Pharmacology and Toxicology. 2001;41:751–773. - PubMed
    1. Houslay MD. Underpinning compartmentalised cAMP signalling through targeted cAMP breakdown. Trends Biochem Sci. 2010;35:91–100. - PubMed
    1. Carnegie GK, Means CK, Scott JD. A-kinase anchoring proteins: from protein complexes to physiology and disease. IUBMB Life. 2009;61:394–406. - PMC - PubMed
    1. Altarejos JY, Montminy M. CREB and the CRTC co-activators: sensors for hormonal and metabolic signals. Nat Rev Mol Cell Biol. 2011;12:141–51. - PMC - PubMed

Publication types

MeSH terms