Comparative Study
. 2012 Feb 24;19(3):116-25.
doi: 10.1101/lm.023937.111.

Impaired associative taste learning and abnormal brain activation in kinase-defective eEF2K mice

Affiliations
Comparative Study

Impaired associative taste learning and abnormal brain activation in kinase-defective eEF2K mice

Iness Gildish et al. Learn Mem. .

Abstract

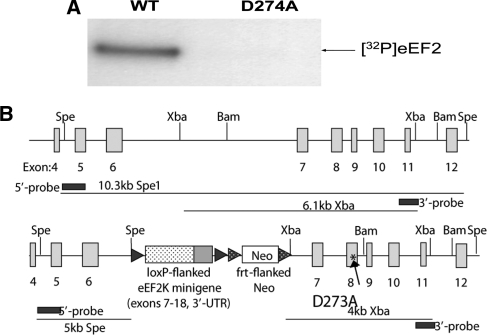
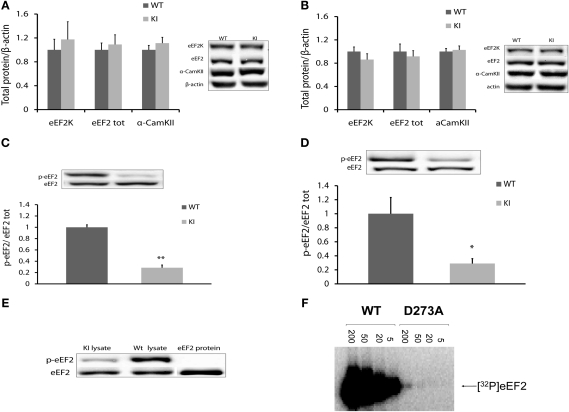
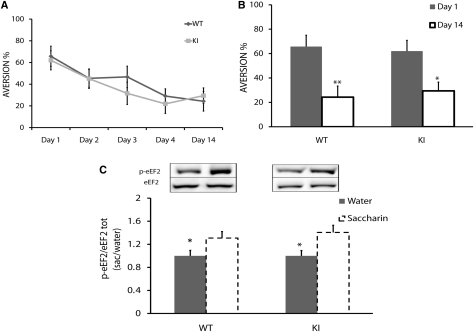
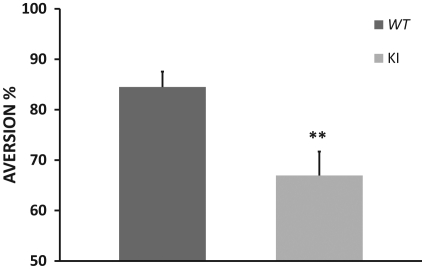
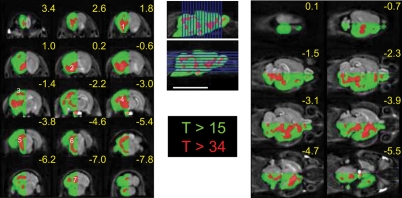
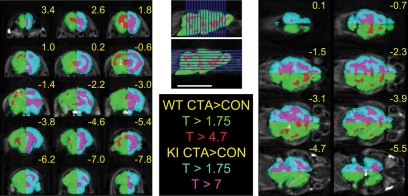
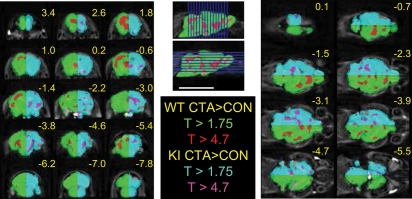
Memory consolidation is defined temporally based on pharmacological interventions such as inhibitors of mRNA translation (molecular consolidation) or post-acquisition deactivation of specific brain regions (systems level consolidation). However, the relationship between molecular and systems consolidation are poorly understood. Molecular consolidation mechanisms involved in translation initiation and elongation have previously been studied in the cortex using taste-learning paradigms. For example, the levels of phosphorylation of eukaryotic elongation factor 2 (eEF2) were found to be correlated with taste learning in the gustatory cortex (GC), minutes following learning. In order to isolate the role of the eEF2 phosphorylation state at Thr-56 in both molecular and system consolidation, we analyzed cortical-dependent taste learning in eEF2K (the only known kinase for eEF2) ki mice, which exhibit reduced levels of eEF2 phosphorylation but normal levels of eEF2 and eEF2K. These mice exhibit clear attenuation of cortical-dependent associative, but not of incidental, taste learning. In order to gain a better understanding of the underlying mechanisms, we compared brain activity as measured by MEMRI (manganese-enhanced magnetic resonance imaging) between eEF2K ki mice and WT mice during conditioned taste aversion (CTA) learning and observed clear differences between the two but saw no differences under basal conditions. Our results demonstrate that adequate levels of phosphorylation of eEF2 are essential for cortical-dependent associative learning and suggest that malfunction of memory processing at the systems level underlies this associative memory impairment.


Figures

Figure 1.
Figure 1.
Characterization of eEF2K ki mice. (A) Purified eEF2 was incubated with [-32P]ATP and recombinant eEF2K (wild-type or D273A) in the presence of calmodulin and calcium (CaCl2) for 5 min, over which period the assay is linear with respect to time. (B) Creation of mice lacking active eEF2 kinase: targeted genome. The figure depicts (cartoon: not to scale) a section of the mouse eEF2 kinase gene in the wild-type (upper) and targeted (lower) forms. The latter includes (1) a minigene comprising exons 7–18 of the eEF2 kinase gene, flanked by loxP sites; (2) a neomycin-resistant cassette flanked by frt sites; and (3) a mutated form of exon 8, introducing the kinase-dead (KD) D274A mutation (arrow; asterisk).
Figure 2.
Figure 2.
Biochemical analysis of hippocampus and cortex of eEF2K ki mice (A,B) eEF2K, eEF2, and α-CaMKII levels in cortex (A) and hippocampus (B) of eEF2K ki mice is normal. Protein levels were normalized to actin and normalized to levels in WT mice. Summary data and representative blots are shown. There is no difference in eEF2K, eEF2, and α-CamKII levels between two mouse types; t-test, n = 5, P > 0.05. (C,D) p-eEF2 levels in cortex (C) and hippocampus (D) of eEF2K ki mice are reduced. Summary data and representative immunoblots are shown. Data are presented as the ratio of p-eEF2-to-eEF2 and normalized to levels of p-eEF2 in WT mice. There are significantly lower levels of p-eEF2 in eEF2K ki mice; t-test, n = 5, *P < 0.05, **P < 0.01. (E) eEF2 phospho-specific antibody (for Thr56 in eEF2) does not react with nonphosphorylated eEF2 protein in Western blot analysis. Immunoblots of eEF2 protein and p-eEF2 for brain and pure protein samples are shown. (F) Purified eEF2 was incubated with [-32P]ATP and the indicated amount of recombinant eEF2K (wild-type or D273A) in the presence of calmodulin and calcium (CaCl2) for 5 min.
Figure 3.
Figure 3.
Normal long-term taste memory in eEF2K ki mice. (A) Y-axis is aversion percentage. There is no difference in attenuation of neophobia for saccharin between the two groups on any test day (ANOVA repeated measures, n = 10, P > 0.05); there is a significant decrease in aversion index for both groups (P < 0.05). (B) Y-axis is aversion percentage. Comparison between aversion indexes on the first test day and 14th test day (same data as in A) during taste learning in transgenic mice (paired t-test, n = 10, *P < 0.05, **P < 0.01), which revealed normal long-term taste memory. (C) p-eEF2 level in GC following novel taste learning. eEF2 phosphorylation increased in the GC within 20 min after novel taste learning in transgenic mice. Representative immunoblots of anti-protein antibody and phospho-specific antibody (Thr56) are presented. Protein levels (p-eEF2/eEF2) are expressed as the ratio between saccharin and water values. Values = 1 indicate no increase or decrease; values > 1 indicate an increase in protein phosphorylation (t-test, n = 9, *P < 0.05).
Figure 4.
Figure 4.
eEF2K ki mice are impaired in CTA learning. Presented is a summary of five independent experiments. Y-axis indicates aversion percentage. eEF2K ki group exhibits lower aversion index than WT group following CTA training (t-test, n ≥ 28, **P < 0.01).
Figure 5.
Figure 5.
High MEMRI signal following fractionated i.p. injections of MnCl2, with predilection for particular brain regions. Coronal (left) and axial (right) slices with indicated positions relative to bregma. Enhanced MRI signal was observed throughout the brain following i.p. injection of 10 mM Mn2+ on alternate days. Gray-scaled half-brain depicts net Mn2+ enhancement obtained by subtracting the mean image of all mice in the Mn2+-injected group from that of those in the noninjected group. The statistical map comparing the net signals of the two groups, overlaid on the other half-brain, shows a very significant enhancement throughout the brain (green, T value > 15). Further increasing the statistical threshold (red, T > 34) demonstrates predisposition to Mn2+ enhancement in specific regions: he olfactory pathway (1), basal ganglia (2), primary sensory cortex (3), midbrain (4), tectum (5), lateral pontine region (6), and cerebellum (7). Lower significance of Mn2+ enhancement at the base of the brain (*) was due to variability in the MRI signal caused by air in the adjacent external ear canal. Localization of slices is shown on the midsagittal slice. Bar = 10 mm.
Figure 6.
Figure 6.
CTA-associated MEMRI signal is higher but less localized in eEF2K ki than in WT mice. Statistical maps derived from the comparisons between groups of mice that underwent CTA and control mice that received i.p. injections of saline instead of LiCl as the unconditioned stimulus. Enhanced MRI signal associated with the CTA procedure can be localized to discrete regions in WT mice (green-red half-brain) but shows a widespread pattern in eEF2K ki mice (cyan-magenta half-brain). Maps of minimum significance threshold (P < 0.05, FDR corrected, T > 1.75) cover most of the brain in WT mice (green) and even more so in ki ones (cyan). In WT mice, localized enhancements (red) in the anterior forebrain (1), sensory cortex (2), antero-dorso-medial thalamus (3), and lateral midbrain and pons (4) are seen by applying the conventional statistical threshold (P < 0.05, FWE corrected, T > 4.7). Conversely, confluent Mn2+ enhancement (magenta) remains in ki mice even following application of an extremely high statistical threshold (P < 0.05, FWE corrected, T > 7).
Figure 7.
Figure 7.
CTA-associated MEMRI signal is stronger in eEF2K ki than in WT mice. The statistical map compares Mn2+ accumulation in the groups of WT and ki mice undergoing the CTA procedure (cyan-magenta half-brain). The minimum statistical threshold map (P < 0.05, FDR corrected, T < 1.75) depicts the generalized, greater increase in Mn2+ accumulation in ki mice (cyan). Several isolated regions of augmented Mn2+ accumulation in this group of mice (magenta) persisted even after application of a higher threshold (P < 0.05, FWE corrected, T < 4.7). The green-red half-brain is as in Figure 5. CTA-associated activation in WT mice prevails rostro-dorsally (red), whereas in ki mice, CTA-associated enhanced Mn2+ accumulation is more abundant ventro-caudally (magenta).

References

    1. Abel T, Lattal KM 2001. Molecular mechanisms of memory acquisition, consolidation, and retrieval. Curr Opin Neurobiol 11: 180–187 - PubMed
    1. Alberini CM 2005. Mechanisms of memory stabilization: Are consolidation and reconsolidation similar or distinct processes? Trends Neurosci 28: 51–56 - PubMed
    1. Aoki I, Naruse S, Tanaka C 2004. Manganese-enhanced magnetic resonance imaging (MEMRI) of brain activity and applications to early detection of brain ischemia. NMR Biomed 17: 569–580 - PubMed
    1. Auerbach BD, Osterweil EK, Bear MF 2011. Mutations causing syndromic autism define an axis of synaptic pathophysiology. Nature 480: 63–68 - PMC - PubMed
    1. Bailey CH, Bartsch D, Kandel ER 1996. Toward a molecular definition of long-term memory storage. Proc Natl Acad Sci 93: 13445–13452 - PMC - PubMed

Publication types

MeSH terms

LinkOut - more resources