. 2012 Mar;135(Pt 3):853-68.
doi: 10.1093/brain/aws010.

Correlates of spreading depolarization in human scalp electroencephalography

Affiliations

Correlates of spreading depolarization in human scalp electroencephalography

Christoph Drenckhahn et al. Brain. 2012 Mar.

Abstract

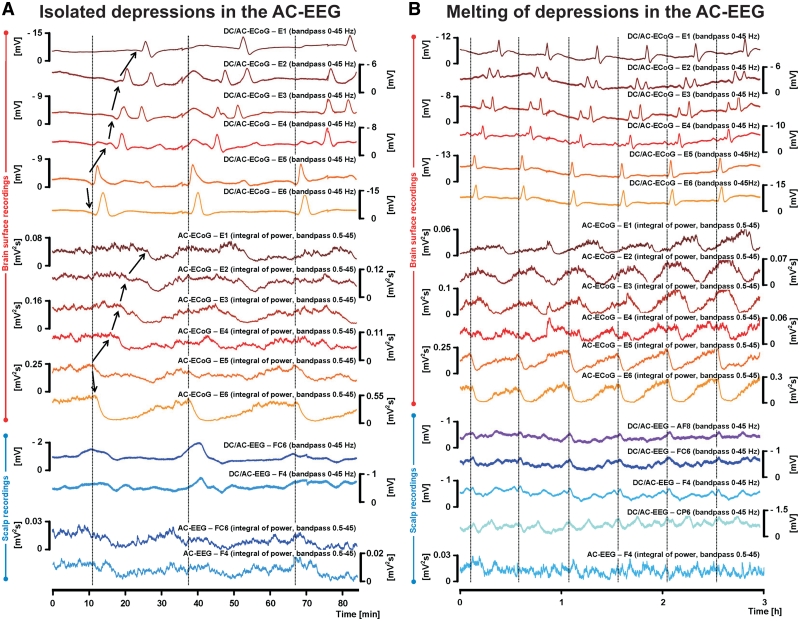
It has been known for decades that suppression of spontaneous scalp electroencephalographic activity occurs during ischaemia. Trend analysis for such suppression was found useful for intraoperative monitoring during carotid endarterectomy, or as a screening tool to detect delayed cerebral ischaemia after aneurismal subarachnoid haemorrhage. Nevertheless, pathogenesis of such suppression of activity has remained unclear. In five patients with aneurismal subarachnoid haemorrhage and four patients with decompressive hemicraniectomy after malignant hemispheric stroke due to middle cerebral artery occlusion, we here performed simultaneously full-band direct and alternating current electroencephalography at the scalp and direct and alternating current electrocorticography at the cortical surface. After subarachnoid haemorrhage, 275 slow potential changes, identifying spreading depolarizations, were recorded electrocorticographically over 694 h. Visual inspection of time-compressed scalp electroencephalography identified 193 (70.2%) slow potential changes [amplitude: -272 (-174, -375) µV (median quartiles), duration: 5.4 (4.0, 7.1) min, electrocorticography-electroencephalography delay: 1.8 (0.8, 3.5) min]. Intervals between successive spreading depolarizations were significantly shorter for depolarizations with electroencephalographically identified slow potential change [33.0 (27.0, 76.5) versus 53.0 (28.0, 130.5) min, P = 0.009]. Electroencephalography was thus more likely to display slow potential changes of clustered than isolated spreading depolarizations. In contrast to electrocorticography, no spread of electroencephalographic slow potential changes was seen, presumably due to superposition of volume-conducted electroencephalographic signals from widespread cortical generators. In two of five patients with subarachnoid haemorrhage, serial magnetic resonance imaging revealed large delayed infarcts at the recording site, while electrocorticography showed clusters of spreading depolarizations with persistent depression of spontaneous activity. Alternating current electroencephalography similarly displayed persistent depression of spontaneous activity, and direct current electroencephalography slow potential changes riding on a shallow negative ultraslow potential. Isolated spreading depolarizations with depression of both spontaneous electrocorticographic and electroencephalographic activity displayed significantly longer intervals between successive spreading depolarizations than isolated depolarizations with only depression of electrocorticographic activity [44.0 (28.0, 132.0) min, n = 96, versus 30.0 (26.5, 51.5) min, n = 109, P = 0.001]. This suggests fusion of electroencephalographic depression periods at high depolarization frequency. No propagation of electroencephalographic depression was seen between scalp electrodes. Durations/magnitudes of isolated electroencephalographic and corresponding electrocorticographic depression periods correlated significantly. Fewer spreading depolarizations were recorded in patients with malignant hemispheric stroke but characteristics were similar to those after subarachnoid haemorrhage. In conclusion, spreading depolarizations and depressions of spontaneous activity display correlates in time-compressed human scalp direct and alternating current electroencephalography that may serve for their non-invasive detection.


Figures

Figure 1
Figure 1
(A) Simultaneous recording of spreading depolarization with spreading depression of spontaneous activity in a patient with aneurismal SAH (Case 1 in Table 1) using electrodes at the cortical surface (electrocorticography; ECoG) and scalp EEG. Recordings were performed on Day 5 after aneurismal SAH. Traces 1–9 show the electrocorticography at electrodes E2, E3 and E4 (red, orange and yellow) (subdural electrode strip), whereas traces 10–18 give the EEG at the ipsilateral scalp electrodes F3, FC5 and T7 (dark blue, green and light blue) (international 10–20 electrode system). Traces 1–3 (near-DC/AC-electrocorticography) and traces 10–12 (DC/AC-EEG) display the slow potential change that identifies spreading depolarization. Traces 4–6 (AC-electrocorticography) and 13–15 (AC-EEG) show the associated depression of spontaneous activity in the conventional EEG bandwidth >0.5 Hz. The integral of power of the conventional EEG bandwidth is calculated in traces 7–9 (AC-electrocorticography) and 16–18 (AC-EEG). The figure illustrates how the integral of power is used to score the duration of the depression period from the initial decrease to the start of the recovery phase. Note slow potential change propagation from electrode E4 to E3 to E2 in cortical surface recordings of traces 1–3 (arrows). In contrast, no spread of the slow potential change is identified by visual inspection of the scalp EEG measurements in traces 10–12 (arrows). In similar fashion, propagation of the depression of spontaneous activity is only seen between subdural electrodes (traces 4–9) but not between scalp electrodes (traces 13–18). Moreover, the duration of the depression period is similar at the three scalp electrodes in contrast to subdural recordings where the duration of the depression period differs between electrodes. This inter-regional uniformity of the scalp EEG is due to summation of volume conducted scalp EEG signals from generators widely distributed over the whole hemisphere (see text). Amplitudes of the slow potential changes (α) were measured in the DC-EEG from the baseline (β) to the peak negativity as shown in trace 12. (B) Series of five spreading depolarizations (marked by asterisk in trace 1) associated with depression of spontaneous activity recorded by electrocorticography and EEG. The recordings are from the same patient and day as those in (A) (delay between A and B: 8 h and 30 min). Traces 1–9 (red, orange and yellow) show the electrocorticography at subdural electrodes E2, E3 and E4 while traces 10–16 (dark blue, green and light blue) give the EEG at the ipsilateral scalp electrodes. Traces 1–3 (near-DC/AC-electrocorticography) and trace 10 (DC/AC-EEG) display the slow potential changes that identify the spreading depolarizations. Traces 4–6 (AC-electrocorticography) and 11–13 (AC-EEG) show the associated depression of spontaneous activity in the conventional EEG bandwidth >0.5 Hz. The integral of power of the conventional EEG bandwidth is calculated in traces 7–9 (AC-electrocorticography) and 14–16 (AC-EEG). Note the recording time of 13.5 h. Also note that the near-DC-electrocorticography recordings of the slow potential changes at the brain surface indicate that the paths of spreading depolarization in the cortex change from third to fourth to fifth spreading depolarization, so the temporal relationships between electrocorticography and EEG vary between the subsequent spreading depolarizations. Thus, the depression of spontaneous activity of the third spreading depolarization starts almost simultaneously in AC-electrocorticography and AC-EEG (marked by broken line a), whereas the depression of the fourth spreading depolarization starts in the AC-EEG prior to the AC-electrocorticography (marked by broken line b) and the depression of the fifth spreading depolarization starts in the AC-electrocorticography prior to the AC-EEG (marked by broken line c). Similar temporal relationships between cortical surface and scalp also apply to the slow potential changes. Varying paths of spreading depolarizations in the cortex thus translate into slightly varying patterns of slow potential changes and depressions in the scalp DC/AC-EEG.
Figure 2
Figure 2
Development of a large delayed ischaemic infarct at the recording area during the monitoring period. (A1) The CT scout view shows the orientation of the electrocorticography (EoG) recording strip (marked by white arrow). (A2) CT scan showing location of subdural electrode E2 (marked by black arrow). (B1) Apparent diffusion coefficient (ADC) map, and (B2) diffusion weighted imaging (DWI) of MRI on Day 2 after aneurismal SAH (aSAH). (C1) Apparent diffusion coefficient map, and (C2) diffusion weighted imaging scan of MRI on Day 7 after aneurismal SAH. Note that the MRI scans of Day 7 display a large new delayed ischaemic infarct in the left middle cerebral artery and posterior cerebral artery territories. (D) Scalp electrode array following the 10–20 system, and electrocorticography recording strip. (E) Transition from spreading depolarizations associated with depression of spontaneous activity to a cluster of silent spreading depolarizations with persistent depression of activity. The electrocorticography and EEG traces are from the same patient as those in Fig. 1 but only recorded on Day 6 after aneurismal SAH between the two MRIs shown in (B) and (C). Traces 1–6 give the electrocorticography at electrodes E3 (red) and E4 (orange), and traces 7–12 the EEG at the ipsilateral scalp electrodes F5 (dark blue) and FC5 (green). Traces 13–15 display the EEG at the contralateral scalp electrode F4 (light blue). Traces 1 and 2 (near-DC/AC-electrocorticography) and traces 7 and 8 (DC/AC-EEG) display the slow potential changes that identify the spreading depolarizations. Traces 3 and 4 (AC-electrocorticography) and 9 and 10 (AC-EEG) show the associated depression of spontaneous activity in the conventional EEG bandwidth >0.5 Hz. The integral of power of the conventional EEG bandwidth is calculated in traces 5 and 6 (AC-electrocorticography) and 11 and 12 (AC-EEG). The first two spreading depolarizations during this recording period of 7 h are associated with depression of spontaneous activity followed by recovery (marked by broken lines a and b). The third spreading depolarization (marked by broken line c) initiates the persistent spreading depression of spontaneous activity during which the electrocorticography displays five silent spreading depolarizations (‘silent’ means that spontaneous activity has already ceased before spreading depolarization onset, see text). Note that the persistent depression of spontaneous AC-electrocorticography activity (traces 3–6) is accompanied by simultaneous depression of spontaneous AC-EEG activity (traces 9–12). Also note the onset of a negative ultraslow potential in scalp electrodes F5 and FC5 (traces 7 and 8) marked by broken line c. In animals, slow potential changes riding on such negative ultraslow potentials are the characteristic signature of neuronal injury (Herreras and Somjen, 1993; Oliveira-Ferreira et al., 2010). Changes at the contralateral electrode F4 are much less pronounced. The mild AC-EEG depression at the contralateral electrode may be caused by the ipsilateral reference at the mastoid. GND = ground; REF = reference.
Figure 3
Figure 3
Cluster of repetitive spreading depolarizations in a patient developing a delayed ischaemic infarct remote from the subdural recording strip (Case 5 in Table 1). (A) Traces 1–6 display the DC/AC-electrocorticography (ECoG) at subdural electrodes E1–E6. Note the slow potential changes that identify three spreading depolarizations in this episode of 80 min duration (vertical lines). The slow potential changes seem to propagate from electrode E5 to the other electrodes (arrows). Also note large amplitudes of the slow potential changes and slow potential changes with two or even three peaks at electrodes E2 to E5. Such twin peaks could reflect longer depolarizations in deeper layers of the cortex (Herreras and Somjen, 1993). Traces 7–12 give the simultaneous integrals of AC-electrocorticography power demonstrating cycles of spreading depression of spontaneous activity (arrows) followed by recovery. Traces 13 and 14 display the slow potential changes at scalp electrodes FC6 (dark blue) and F4 (light blue) that correspond to the slow potential changes at the cortical surface. The integrals of EEG power in traces 15 (electrode FC6) and 16 (electrode F4) show isolated cycles of depression in spontaneous activity followed by recovery similar to the invasive recordings. In contrast to the subdural recordings, no propagation of slow potential changes and depression periods is observed between scalp electrodes. (B) One day later, spreading depolarizations continue to recur at high frequency. Arrangement of traces, electrodes and filter settings is similar to (A) but the DC/AC-EEG recordings at scalp electrodes AF8 and CP6 are demonstrated in addition to those at scalp electrodes FC6 and F4 to illustrate variations in scalp slow potential change patterns. Note correspondence between slow potential changes at scalp and cortical surface (vertical lines). It seems that subsequent depression periods are fused at scalp electrode F4 (integral of power in trace 17) although subdural electrodes still show isolated cycles of spreading depression followed by recovery of spontaneous activity at the cortical surface.
Figure 4
Figure 4
Development of a large delayed ischaemic infarct at the recording area during the monitoring period (Case 2 in Table 1). (A) MPRAGE (magnetization prepared rapid gradient echo)-sequence, a T1-weighted, gradient-echo sequence visualizing the subdural recording strip (marked by white arrow). (B) The CT scout view shows the orientation of the electrocorticography (ECoG) recording strip (marked by white arrow). (C1 and C2) Diffusion weighted MRI (DWI) shows an infarct in the posterior territory of the left middle cerebral artery on Day 3. (D1 and D2) On Day 7, a new delayed ischaemic infarct is visualized in the left anterior middle cerebral artery territory including the recording area. Moreover, a small delayed infarct is seen in the left anterior cerebral artery territory. (E) The initial spreading depolarization of the cluster is displayed that is completely depicted at lower resolution in Fig. 5. The cluster occurred on Day 4 after aneurismal SAH between the two MRIs of Days 3 and 7. Traces 1–5 show the near-DC/AC-electrocorticography recordings at subdural electrodes E1 to E5 measured by the GT205 amplifier whereas traces 6–10 simultaneously give the DC/AC-electrocorticography recordings measured by the BrainAmp amplifier. Note that the slow potential change is distorted in the near-DC/AC-electrocorticography recordings in traces 2–5, which precludes assessment of its duration (Hartings et al., 2009) in contrast to the slow potential change depicted in the DC/AC-electrocorticography recordings in traces 7–10. The slow potential change propagates from electrode E5 to E2 (arrows). Trace 11 (blue) provides the slow potential change simultaneously measured by electrode FC5 at the scalp. Traces 12–16 depict the spreading depression of spontaneous activity in the power of the AC-electrocorticography at subdural electrodes E1 to E5. The lowest trace (green) displays the tissue partial pressure of oxygen. Abrupt, marked reduction of tissue oxygen accompanies spreading depolarization as measured close to electrode E6 using an intraparenchymal oxygen sensor (Licox, Integra Lifesciences Corporation). This may be the consequence of a combination of reduced blood supply (inverse coupling) with increased oxygen consumption in response to spreading depolarization (Dreier et al., 2009). Note that the spreading depolarization does not propagate to subdural electrode E1. Electrode E1 was positioned on a neighbouring gyrus that was not affected by the new infarct. Because of artefacts in lower frequencies, we chose a bandpass between 30 and 45 Hz to illustrate the depression of spontaneous activity in the subdural recordings.
Figure 5
Figure 5
Cluster of silent spreading depolarizations riding on a negative ultraslow potential during development of a new delayed ischaemic infarct (Case 2 in Table 1). Figure 4 depicts the first spreading depolarization of this cluster at high resolution in addition to the neuroimaging findings. Similar to Fig. 4, traces 1–5 show the near-DC/AC-electrocorticography (ECoG) recordings at subdural electrodes E1 to E5 measured by the GT205 amplifier, whereas traces 6–10 simultaneously give the DC/AC-electrocorticography recordings measured by the BrainAmp amplifier. The near-DC/AC- and DC/AC-electrocorticography recordings display the slow potential changes that identify the spreading depolarizations. The arrow marks the first spreading depolarization in traces 2–5. The first spreading depolarization causes persistent spreading depression of spontaneous activity, as shown in traces 13–16 (power of subdural electrodes E1–E5, arrows), trace 17 (integral of power at electrode E2) and trace 18 (integral of power at scalp electrode FC5). The multiple subsequent spreading depolarizations in traces 2–5 and 7–10, respectively, occur during this persistent depression of spontaneous activity (silent spreading depolarizations). Note in the DC/AC-electrocorticography recordings of traces 7–10 that the recurrent slow potential changes ride on a negative ultraslow potential (marked by the stars). This negative ultraslow injury potential is largest at electrodes E3 to E5 and seems reflected in a shallow negative ultraslow potential at scalp electrode FC5 (trace 11). Note that no slow potential changes/spreading depolarizations occur at subdural electrode E1 which was located on another gyrus spared from infarction. Interestingly, an ultraslow positive potential (current source) is seen at subdural electrode E1 (star at trace 6) in contrast to the ultraslow negative potential (current sink) at the other electrodes, remarkably similar to findings in and around infarcts in animals (Oliveira-Ferreira et al., 2010). Trace 19 shows a persistent decrease of tissue partial pressure of oxygen as measured with an oxygen sensor. Note recurrent decreases of tissue oxygen in response to the spreading depolarizations. Cerebral perfusion pressure is constant during the event. Because of artefacts in lower frequencies, we chose a bandpass between 30 and 45 Hz to illustrate the depression of spontaneous activity in the subdural recordings.

References

    1. Back T, Kohno K, Hossmann KA. Cortical negative DC deflections following middle cerebral artery occlusion and KCl-induced spreading depression: effect on blood flow, tissue oxygenation, and electroencephalogram. J Cereb Blood Flow Metab. 1994;14:12–9. - PubMed
    1. Bosche B, Graf R, Ernestus RI, Dohmen C, Reithmeier T, Brinker G, et al. Recurrent spreading depolarizations after SAH decrease oxygen availability in human cerebral cortex. Ann Neurol. 2010;67:607–17. - PMC - PubMed
    1. Canals S, Makarova I, Lopez-Aguado L, Largo C, Ibarz JM, Herreras O. Longitudinal depolarization gradients along the somatodendritic axis of CA1 pyramidal cells: a novel feature of spreading depression. J Neurophysiol. 2005;94:943–51. - PubMed
    1. Claassen J, Hirsch LJ, Kreiter KT, Du EY, Connolly ES, Emerson RG, et al. Quantitative continuous EEG for detecting delayed cerebral ischemia in patients with poor-grade subarachnoid hemorrhage. Clin Neurophysiol. 2004;115:2699–710. - PubMed
    1. Claassen J, Mayer SA, Hirsch LJ. Continuous EEG monitoring in patients with subarachnoid hemorrhage. J Clin Neurophysiol. 2005;22:92–8. - PubMed

Publication types

MeSH terms