. 2012 Feb 26;18(3):413-21.
doi: 10.1038/nm.2669.

Oocyte formation by mitotically active germ cells purified from ovaries of reproductive-age women

Affiliations

Oocyte formation by mitotically active germ cells purified from ovaries of reproductive-age women

Yvonne A R White et al. Nat Med. .

Abstract

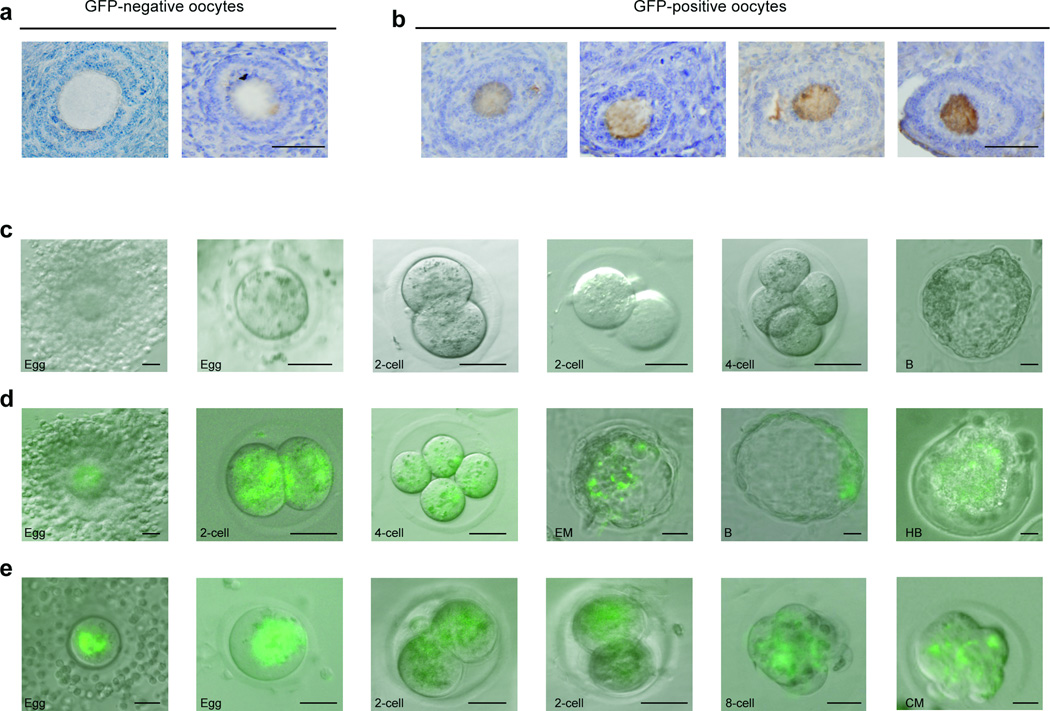
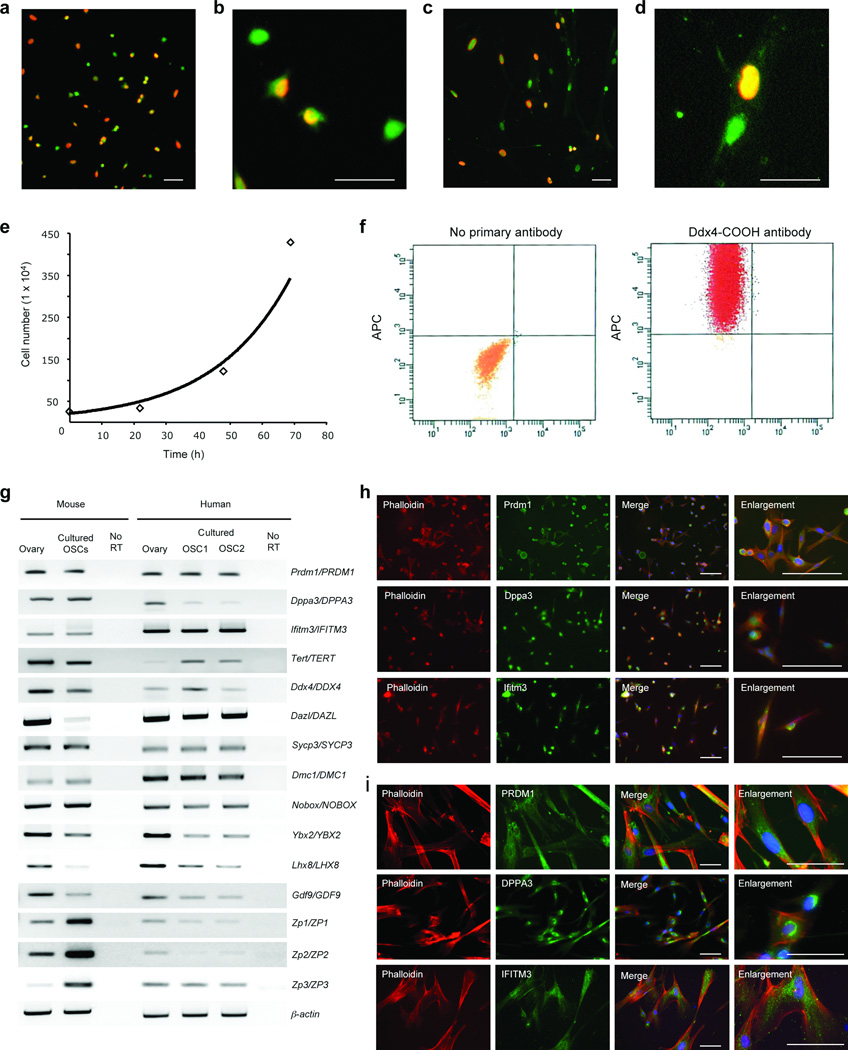
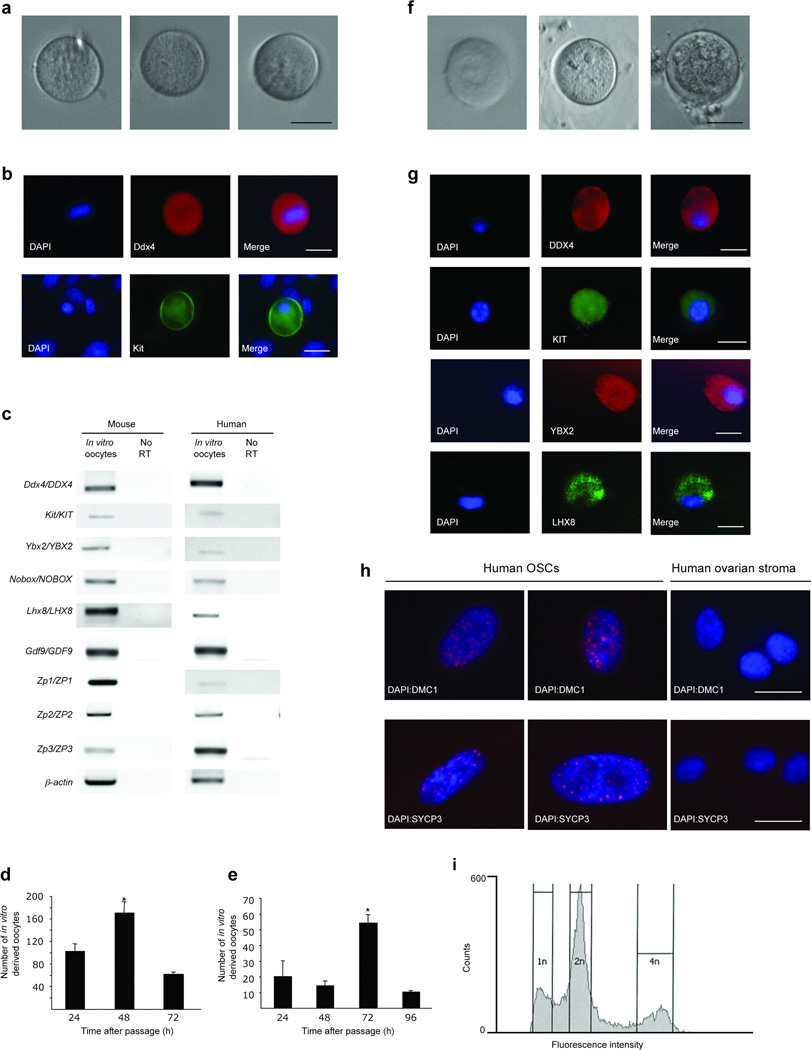
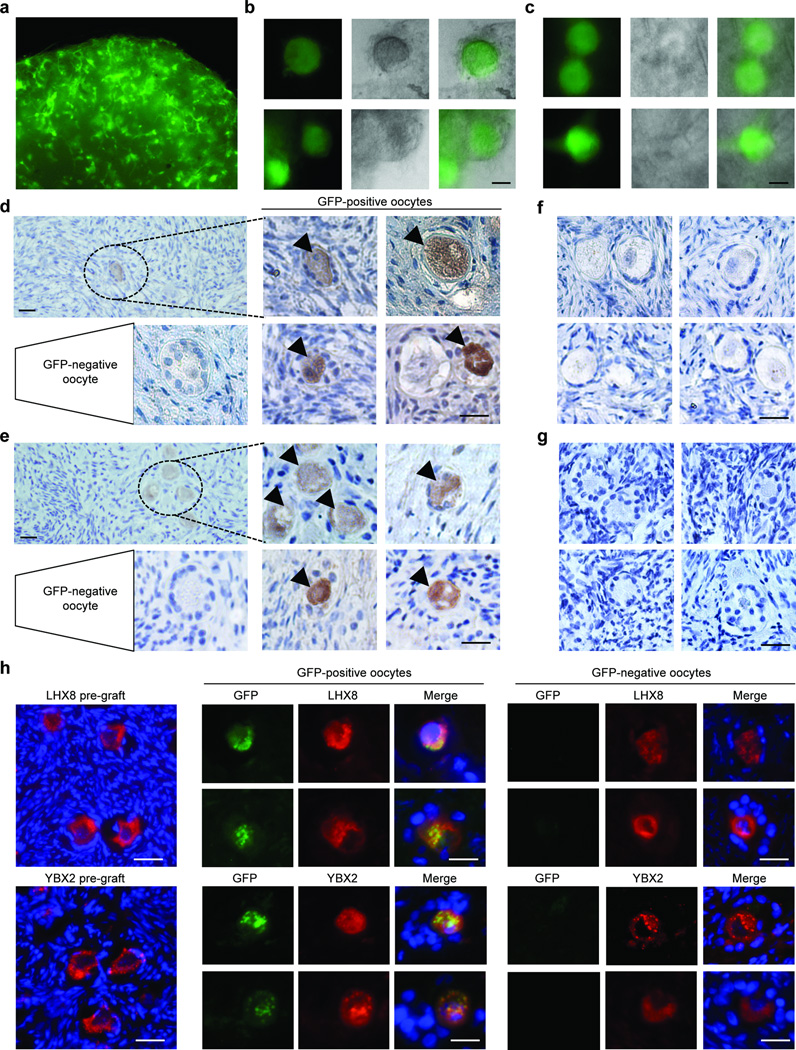
Germline stem cells that produce oocytes in vitro and fertilization-competent eggs in vivo have been identified in and isolated from adult mouse ovaries. Here we describe and validate a fluorescence-activated cell sorting-based protocol that can be used with adult mouse ovaries and human ovarian cortical tissue to purify rare mitotically active cells that have a gene expression profile that is consistent with primitive germ cells. Once established in vitro, these cells can be expanded for months and can spontaneously generate 35- to 50-μm oocytes, as determined by morphology, gene expression and haploid (1n) status. Injection of the human germline cells, engineered to stably express GFP, into human ovarian cortical biopsies leads to formation of follicles containing GFP-positive oocytes 1-2 weeks after xenotransplantation into immunodeficient female mice. Thus, ovaries of reproductive-age women, similar to adult mice, possess rare mitotically active germ cells that can be propagated in vitro as well as generate oocytes in vitro and in vivo.


Figures

Fig. 1
Fig. 1
FACS-based protocol for OSC isolation. a, Immunofluorescence analysis of Ddx4 expression (green; blue DAPI counterstain) in adult mouse ovaries using antibodies against the NH2 or COOH terminus (scale bars, 50-µm). b, Immunomagnetic sorting of dispersed mouse ovaries or isolated oocytes using antibodies against the NH2 or COOH terminus of Ddx4. Fraction 1, cells plus beads before separation; Fraction 2, wash fraction (non-immunoreactive); Fraction 3, bead fraction (Ddx4-positive cells, highlighted by white arrows). c, FACS analysis of live or permeabilized cells from dispersed mouse ovaries using antibodies against the NH2 or COOH terminus of Ddx4. Viable Ddx4-positive cells are only detected with the COOH antibody (red dashed box) whereas permeabilization enables isolation of Ddx4-positive cells using the NH2 antibody (blue dashed box). d, Permeabilization of viable Ddx4-positive cells obtained with the COOH antibody (red dashed box) enables re-isolation of the same cells by FACS using the NH2 antibody (blue dashed box), as shown by shift in fluorescence (red to blue indicates shift from APC-positive live cells to 488-positive fixed and permeabilized cells). e, Schematic of FACS protocols employed to validate use of the Ddx4-COOH antibody for isolation of viable OSCs. f, Expression analysis of germline markers (Prdm1, Dppa3, Ifitm3, Tert, Ddx4, Dazl) and oocyte markers (Nobox, Zp3, Gdf9) in each cell fraction produced during the ovarian dispersion process to obtain cells for FACS-based isolation of OSCs (+ve, Ddx4-positive viable cell fraction after FACS; −ve, Ddx4-negative viable cell fraction after FACS; No RT, PCR of RNA sample without reverse transcription; β-actin, sample loading control).
Fig. 2
Fig. 2
Isolation of OSCs from adult mouse and human ovaries. a, b, Representative histological appearance of adult ovarian tissue used for human (a) and mouse (b) OSC isolation. Scale bars, 100-µm. c, d, Morphology of viable cells isolated by FACS based on cell-surface expression of Ddx4/DDX4. Scale bars, 10-µm. e, Gene expression profile of starting ovarian material and freshly-isolated OSCs, showing assessment of three different subjects as examples for human ovarian tissue analysis (No RT: PCR of RNA sample without reverse transcription; β-actin, sample loading control). f, g, Teratoma formation assay showing an absence of tumors in NOD-SCID mice 24 weeks after receiving injections of freshly-isolated mouse OSCs (f) compared with development of tumors in mice 3 weeks after injection of an equivalent number of mouse ESCs (g; tumor highlighted by black-dashed oval). h, Examples of cells from all three germ layers in a representative ESC-derived teratoma are shown, with neural rosette highlighted in inset of left panel (scale bars, 100-µm).
Fig. 3
Fig. 3
Mouse OSCs generate functional eggs after intraovarian transplantation. a, Examples of growing follicles containing GFP-negative and GFP-positive (brown; blue hematoxylin counterstain) oocytes in ovaries of wild-type mice injected with GFP-expressing OSCs 5–6 months earlier. b, Examples of ovulated GFP-negative eggs (in cumulus-oocyte complexes), and resultant embryos [2-cell, 4-cell, compact morula (CM) and early blastocyst (EB) stage embryos are shown as examples] generated by IVF, following induced ovulation of wild-type female mice that received intraovarian transplantation of GFP-expressing OSCs 5–6 months earlier. c, d, Examples of GFP-positive eggs (in cumulus-oocyte complexes) obtained from the oviducts following induced ovulation of wild-type female mice that received intraovarian transplantation of GFP-expressing OSCs 5–6 months earlier. These eggs were in-vitro fertilized using wild-type sperm, resulting in 2-cell embryos that progressed through preimplantation development [examples of GFP-positive embryos at the 2-cell, 4-cell, 8-cell, compacted morula (CM), expanded morula (EM), blastocyst (B) and hatching blastocyst (HB) stage are shown] to form hatching blastocysts 5–6 days after fertilization. Scale bars, 30-µm.
Fig. 4
Fig. 4
Evaluation of mouse and human ovary-derived OSCs in defined cultures. a–d, Assessment of OSC proliferation by dual detection of Ddx4/DDX4 expression (green) and BrdU incorporation (red) in mouse (a, b) and human (c, d) OSCs maintained in MEF-free cultures. Scale bars, 30-µm. e, Typical growth curve for MEF-free cultures of mouse OSCs after passage and seeding 2.5 × 10⁴ cells in each well of 24-well culture plates. f, FACS analysis using the COOH antibody to detect cell-surface expression of Ddx4 in mouse OSCs after months of propagation (example shown, passage 45). g, Gene expression profile of starting ovarian material and cultured mouse and human OSCs after four or more months of propagation in vitro (No RT, PCR of RNA sample without reverse transcription; β-actin, sample loading control). Two different human OSC lines (OSC1 and OSC2) established from ovaries of two different subjects are shown as examples. h, i, Immunofluorescence analysis of Prdm1/PDRM1, Dppa3/DPPA3 and Ifitm3/IFITM3 expression (green) in mouse (h) and human (i) OSCs in MEF-free cultures. Cells were counterstained with DAPI (blue) and rhodamine-phalloidin (red) to visualize nuclear DNA and cytoplasmic F-actin, respectively. Scale bars, 50-µm.
Fig. 5
Fig. 5
Spontaneous oocyte generation by cultured mouse and human OSCs. a–c, Oocytes formed by mouse OSCs in culture, as assessed by morphology (a), expression of oocyte marker proteins Ddx4 and Kit (b; note cytoplasmic localization of Ddx4 in oocytes), and presence of mRNAs encoding oocyte marker genes Ddx4, Kit, Ybx2, Nobox, Lhx8, Gdf9, Zp1, Zp2 and Zp3 (c; No RT: PCR of RNA sample without reverse transcription; β-actin, sample loading control). Scale bars, 25-µm. d, Number of oocytes formed by mouse OSCs after passage and seeding 2.5 × 10⁴ cells in each culture well analyzed (values represent numbers generated over each 24-h block, not cumulative numbers; mean ± s.e.m., n = 3 independent cultures; *, P = 0.002 versus other groups). e–g, In-vitro oogenesis from human OSCs, with examples of oocytes formed by human OSCs in culture (f, morphology; g, expression of oocyte marker proteins DDX4, KIT, YBX2 and LHX8) and numbers formed following passage and seeding of 2.5 × 10⁴ cells in each culture well analyzed (e; mean ± s.e.m., n = 3 independent cultures; *, P = 0.002 versus other groups) shown. Expression of oocyte marker genes (DDX4, KIT, YBX2, NOBOX, LHX8, GDF9, ZP1, ZP2, ZP3) in human OSC-derived oocytes is shown in c, along with results for mouse OSC-derived oocytes. Scale bars, 25-µm. h, Immunofluorescence detection of the meiotic recombination markers, DMC1 and SYCP3 (red; blue DAPI counterstain), in nuclei of cultured human OSCs; human ovarian stromal cells served as a negative control. Scale bars, 15-µm. i, FACS-based ploidy analysis of cultured human OSCs 72 h after passage (see also Supplementary Fig. S4).
Fig. 6
Fig. 6
Human OSCs generate oocytes in human ovary tissue. a–c, Direct (live-cell) GFP fluorescence analysis of human ovarian cortical tissue following dispersion, re-aggregation with GFP-hOSCs (a) and in-vitro culture for 24–72 h (b, c), showing formation of large single GFP-positive cells surrounded by smaller GFP-negative cells in compact structures resembling follicles (b, c; scale bars, 50-µm). d–g, Immature follicles containing GFP-positive oocytes (brown, highlighted by black arrowheads, against a blue hematoxylin counterstain) in adult human ovarian cortical tissue injected with GFP-hOSCs and xenografted into NOD-SCID female mice (d, 1 week post-transplant; f, 2 weeks post-transplant). Note comparable follicles with GFP-negative oocytes in the same grafts. As negative controls, all immature follicles in human ovarian cortical tissue prior to GFP-hOSC injection and xenografting (e) or that received vehicle injection (no GFP-hOSCs) prior to xenografting (g) contained GFP-negative oocytes after processing for GFP detection in parallel with the samples shown. Scale bars, 25-µm. h, Dual immunofluorescence analysis of GFP expression (green) and either the diplotene stage oocyte-specific marker YBX2 (red) or the oocyte transcription factor LHX8 (red) in xenografts receiving GFP-hOSC injections. Note that GFP was not detected in grafts prior to GFP-hOSC injection, whereas YBX2 and LHX8 were detected in all oocytes. Sections were counterstained with DAPI (blue) for visualization of nuclei. Scale bars, 25-µm.

Comment in

  • The quest for human ovarian stem cells.
    Telfer EE, Albertini DF. Telfer EE, et al. Nat Med. 2012 Mar 6;18(3):353-4. doi: 10.1038/nm.2699. Nat Med. 2012. PMID: 22395699 No abstract available.
  • Adult human and mouse ovaries lack DDX4-expressing functional oogonial stem cells.
    Zhang H, Panula S, Petropoulos S, Edsgärd D, Busayavalasa K, Liu L, Li X, Risal S, Shen Y, Shao J, Liu M, Li S, Zhang D, Zhang X, Gerner RR, Sheikhi M, Damdimopoulou P, Sandberg R, Douagi I, Gustafsson JÅ, Liu L, Lanner F, Hovatta O, Liu K. Zhang H, et al. Nat Med. 2015 Oct;21(10):1116-8. doi: 10.1038/nm.3775. Nat Med. 2015. PMID: 26444631 No abstract available.
  • Woods and Tilly reply.
    Woods DC, Tilly JL. Woods DC, et al. Nat Med. 2015 Oct;21(10):1118-21. doi: 10.1038/nm.3964. Nat Med. 2015. PMID: 26444632 Free PMC article. No abstract available.

Similar articles

Cited by

References

    1. Zuckerman S. The number of oocytes in the mature ovary. Rec. Prog. Horm. Res. 1951;6:63–108.
    1. Johnson J, Canning J, Kaneko T, Pru JK, Tilly JL. Germline stem cells and follicular renewal in the postnatal mammalian ovary. Nature. 2004;428:145–150. - PubMed
    1. Brinster RL. Male germline stem cells: from mice to men. Science. 2007;316:404–405. - PMC - PubMed
    1. Tilly JL, Niikura Y, Rueda BR. The current status of evidence for and against postnatal oogenesis in mammals: a case of ovarian optimism versus pessimism? Biol. Reprod. 2009;80:2–12. - PMC - PubMed
    1. Zou K, et al. Production of offspring from a germline stem cell line derived from neonatal ovaries. Nat. Cell Biol. 2009;11:631–636. - PubMed

Publication types

MeSH terms