. 2012 Aug;64(4):429-41.
doi: 10.1007/s10616-011-9421-2. Epub 2012 Feb 25.

Real-time monitoring of adherent Vero cell density and apoptosis in bioreactor processes

Affiliations

Real-time monitoring of adherent Vero cell density and apoptosis in bioreactor processes

Emma Petiot et al. Cytotechnology. 2012 Aug.

Abstract

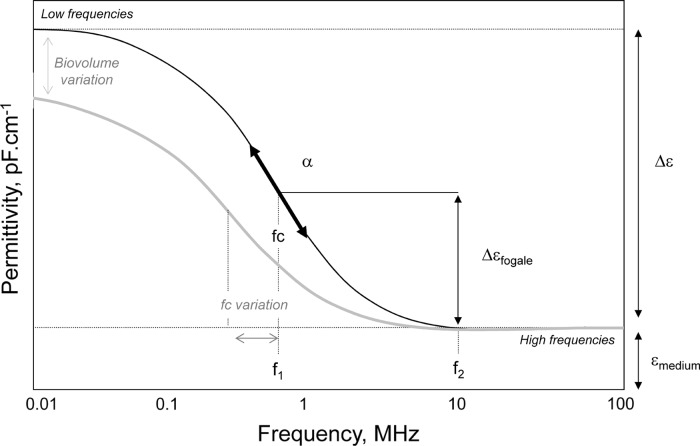
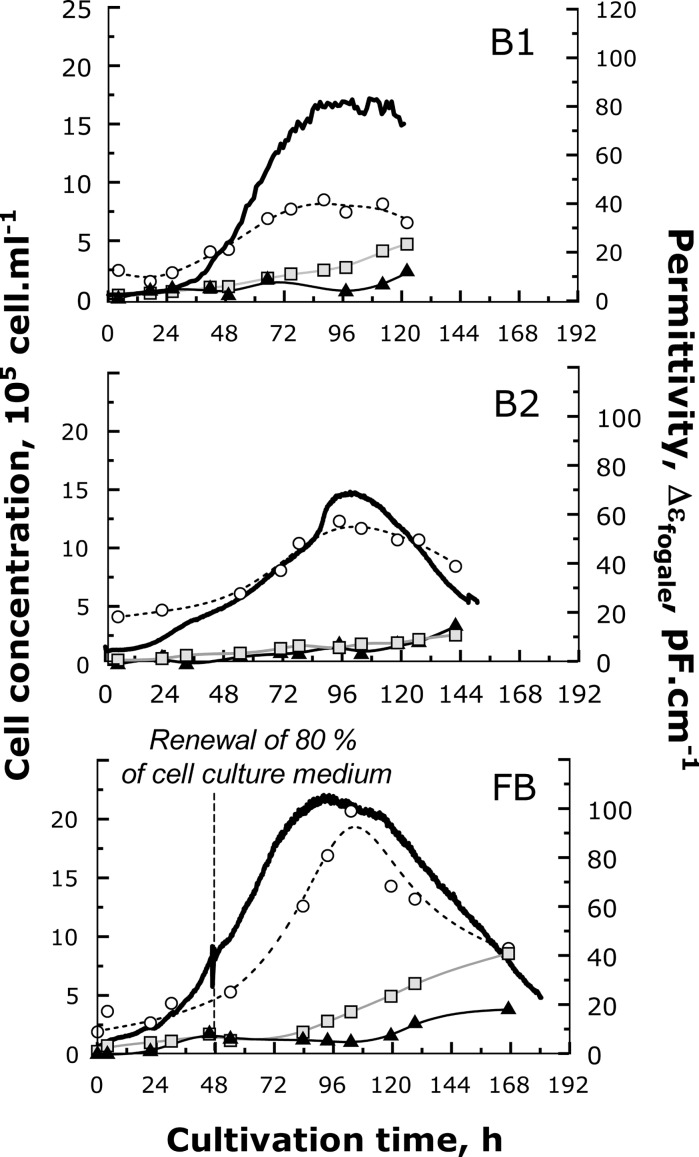
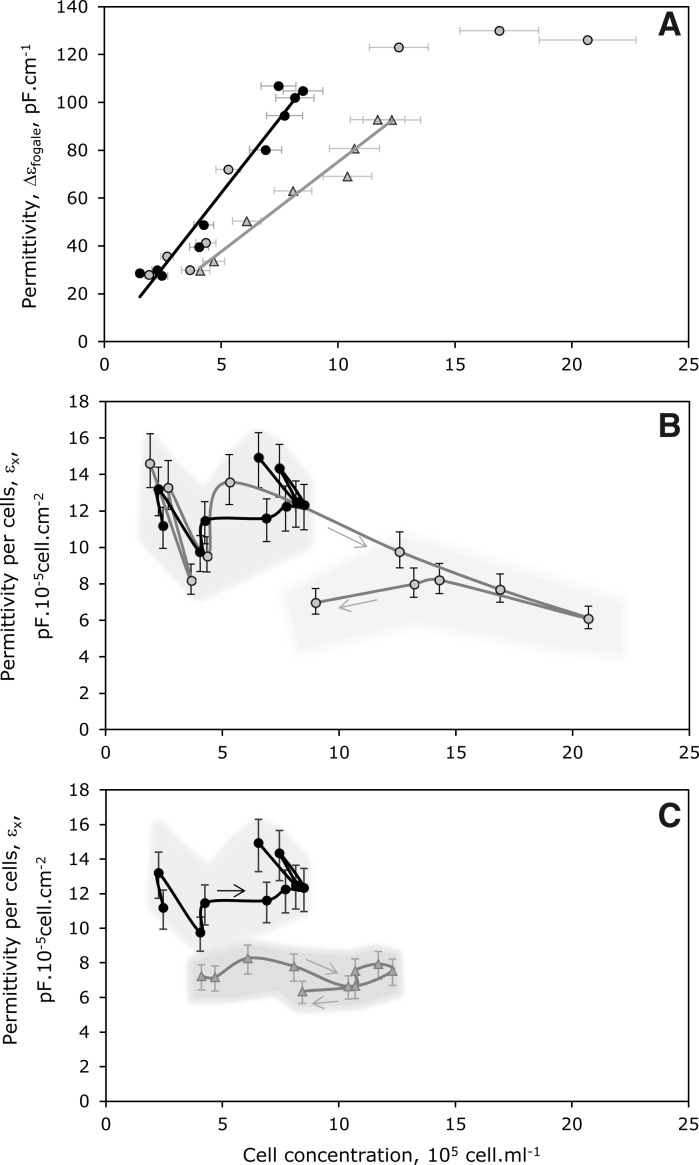
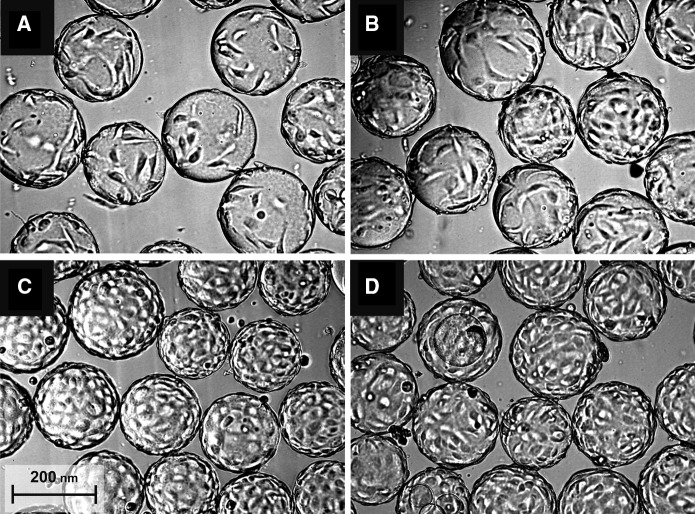
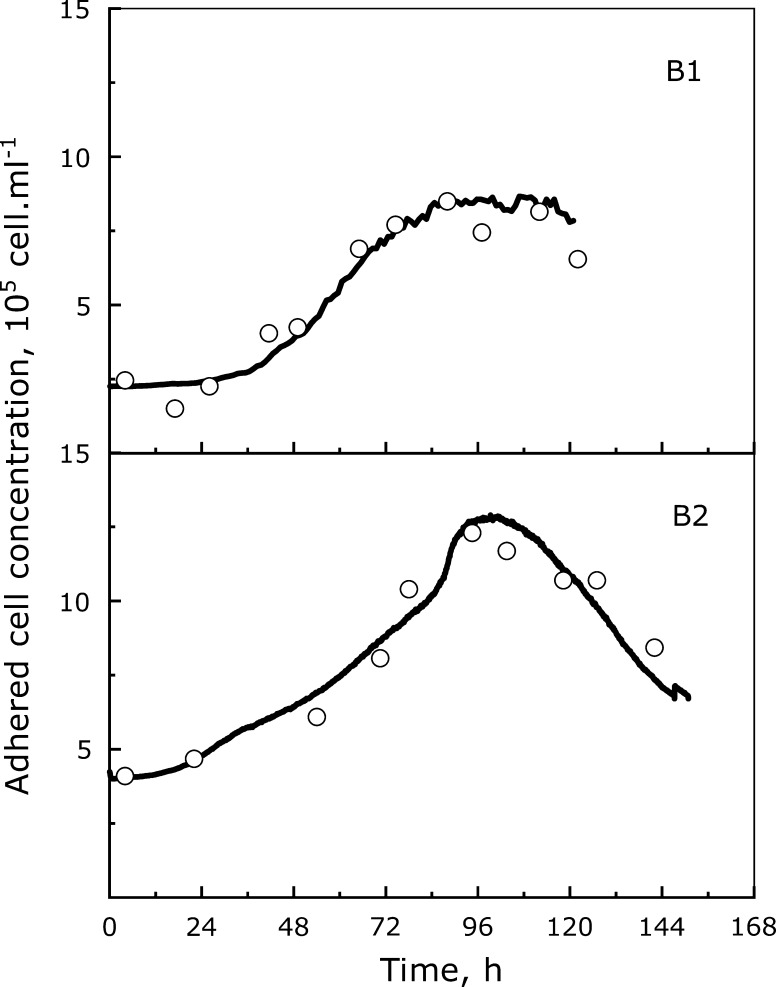
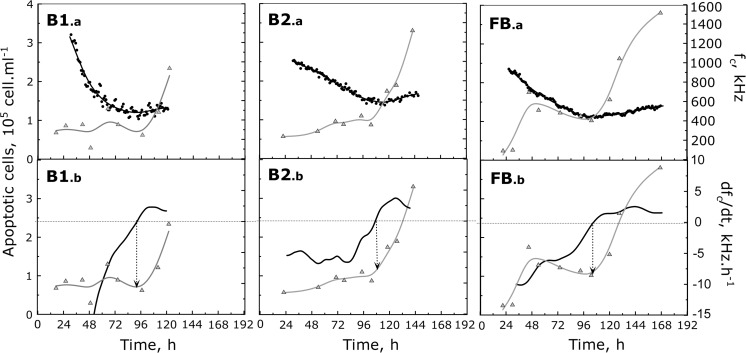
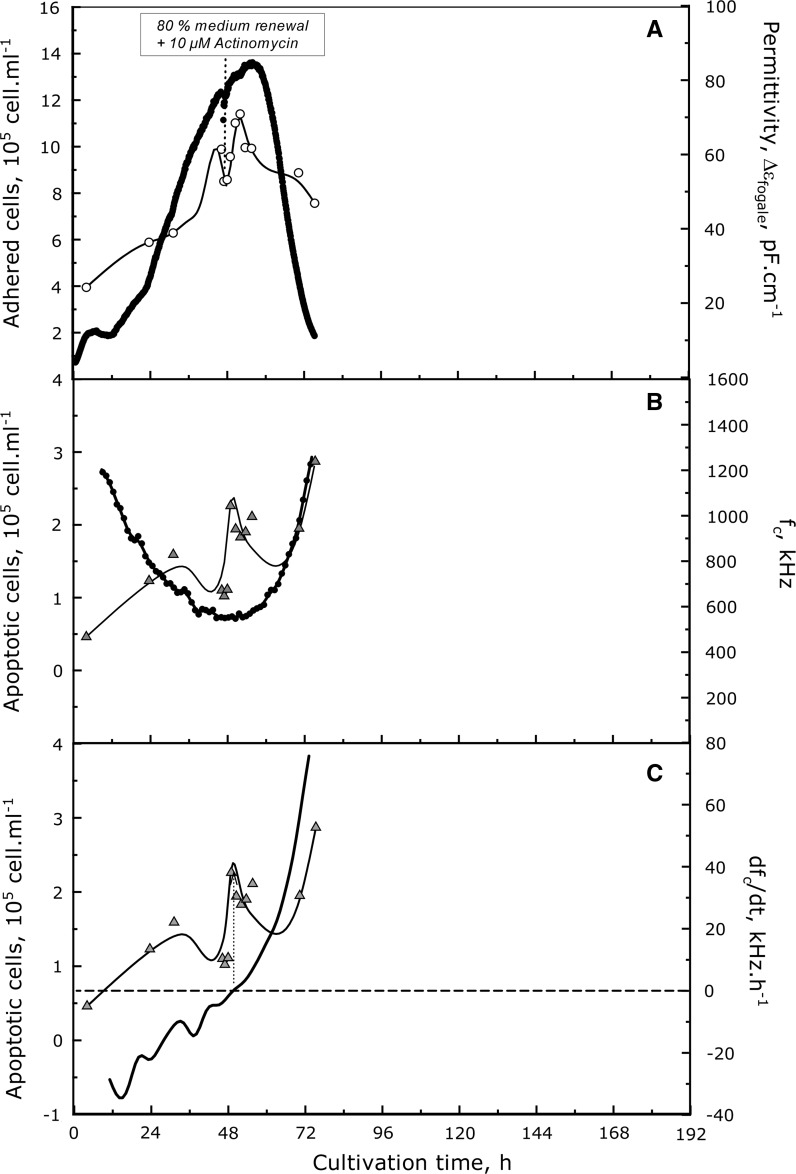
This study proposes an easy to use in situ device, based on multi-frequency permittivity measurements, to monitor the growth and death of attached Vero cells cultivated on microporous microcarriers, without any cell sampling. Vero cell densities were on-line quantified up to 10(6) cell mL(-1). Some parameters which could potentially impact Vero cell morphological and physiological states were assessed through different culture operating conditions, such as media formulation or medium feed-harvest during cell growth phase. A new method of in situ cell death detection with dielectric spectroscopy was also successfully implemented. Thus, through permittivity frequency scanning, major rises of the apoptotic cell population in bioreactor cultures were detected by monitoring the characteristic frequency of the cell population, f(c), which is one of the culture dielectric parameters. Both cell density quantification and cell apoptosis detection are strategic information in cell-based production processes as they are involved in major events of the process, such as scale-up or choice of the viral infection conditions. This new application of dielectric spectroscopy to adherent cell culture processes makes it a very promising tool for risk-mitigation strategy in industrial processes. Therefore, our results contribute to the development of Process Analytical Technology in cell-based industrial processes.


Figures

Fig. 1
Fig. 1
Schematical representation of the β-dispersion of permittivity. β-dispersion and variation of its characteristic parameters, Δε, fc and α are presented. The determinations of Δεfogale as well as the influence of a variation of cell characteristics or biovolume on the β-dispersion are also presented
Fig. 2
Fig. 2
Evolution with time of cell populations and on-line permittivity. Viable (open circle), apoptotic (black triangle) and lysed (gray square) Vero cells during batch cultures performed in serum-free conditions with (FB) or without (B1 and B2) medium renewal with in-line permittivity acquisition (continuous black lines). Cultures B1 and FB were performed in MR medium while B2, was performed in MM medium
Fig. 3
Fig. 3
Evolution of the permittivity formula image and the specific permittivity, εX, with the adhered Vero cell concentration. A Correlation between permittivity formula image and concentration of Vero cells attached on microcarriers, during Batch 1 (B1: black circle), Batch 2 (B2: gray triangle) and Batch with 80% of medium renewal (FB: gray circle). B and C Evolution of specific permittivity, εX, corresponding to permittivity values acquired per cells for B1 (black circle), B2 (grey triangle) and FB (gray circle). The grey area represents the variability of εX for each culture
Fig. 4
Fig. 4
Microscopic observation of Vero cells attached on microcarriers. Evolution of Vero cell morphology on microporous microcarriers at 4 h (A), 56 h (B), 70 h (C) and 94 h (D) after cell seeding, during culture performed with 80% of medium renewal after 48 h of culture (FB)
Fig. 5
Fig. 5
Comparison of attached cell kinetics quantified off-line (open circle) and on-line through permittivity measurements (continuous black lines)
Fig. 6
Fig. 6
Detection of Vero cell apoptosis with characteristic frequency monitoring. Evolution with time of apoptotic cell concentration (grey triangle), compared with the characteristic frequency, fc (A) or with its derivative, dfc/dt (b) (both represented with black lines), during batch cultures (B1 and B2) and batch culture performed with 80% medium renewal after 48 h (FB)
Fig. 7
Fig. 7
Apoptosis induction during the exponential growth phase of a batch culture of Vero cell with medium renewal. Apoptosis was induced with the addition of 10 μM of actinomycin D at 48 h of culture after 80% of medium renewal. Adhered cell concentration (open circle) is plotted together with the on-line permittivity measurements (continuous black lines) (A). Apoptotic cell concentrations (triangle: B, C) were compared to characteristic frequency fc (B) or its derivative, dfc/dt (C)

Similar articles

Cited by

References

    1. Al-Rubeai M. Apoptosis and cell culture technology. Adv Biochem Eng Biotechnol. 1998;59:225–249. doi: 10.1007/BFb0102300. - DOI - PubMed
    1. Ansorge S, Esteban G, Schmid G. On-line monitoring of infected Sf-9 insect cell cultures by scanning permittivity measurements and comparison with off-line biovolume measurements. Cytotechnology. 2007;55:115–124. doi: 10.1007/s10616-007-9093-0. - DOI - PMC - PubMed
    1. Ansorge S, Esteban G, Schmid G. Multifrequency permittivity measurements enable on-line monitoring of changes in intracellular conductivity due to nutrient limitations during batch cultivations of CHO cells. Biotechnol Prog. 2010;26:272–283. - PubMed
    1. Ansorge S, Lanthier S, Transfiguracion J, Henry O, Kamen A (2011) Monitoring lentiviral vector production kinetics using online permittivity measurements. Biochem Eng J 54:16–25
    1. Bradamante S, Barenghi L, Villa A. Simulated weightlessness in the design and exploitation of a NMR-compatible bioreactor. Biotechnol Prog. 2004;20:1454–1459. doi: 10.1021/bp049816k. - DOI - PubMed

LinkOut - more resources