. 2012 May;191(1):119-31.
doi: 10.1534/genetics.111.137976. Epub 2012 Feb 23.

Temperature-sensitive and circadian oscillators of Neurospora crassa share components

Affiliations

Temperature-sensitive and circadian oscillators of Neurospora crassa share components

Suzanne Hunt et al. Genetics. 2012 May.

Abstract

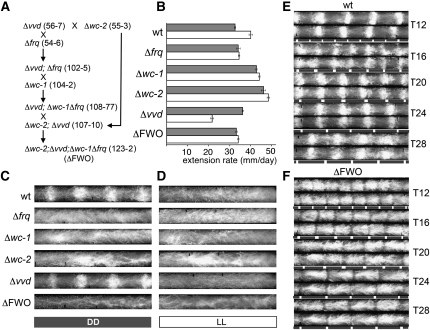
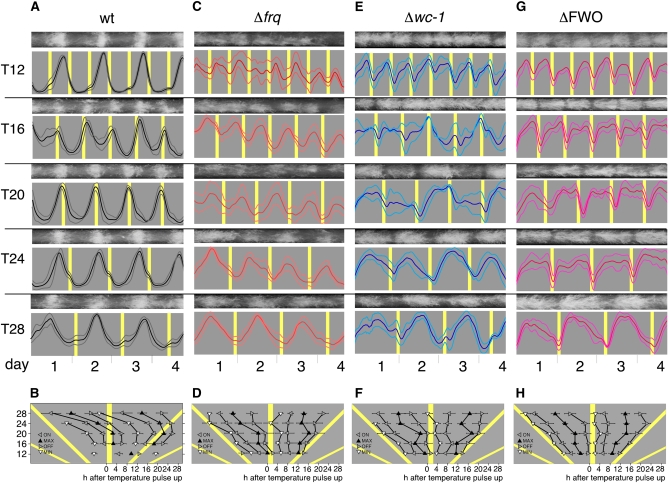
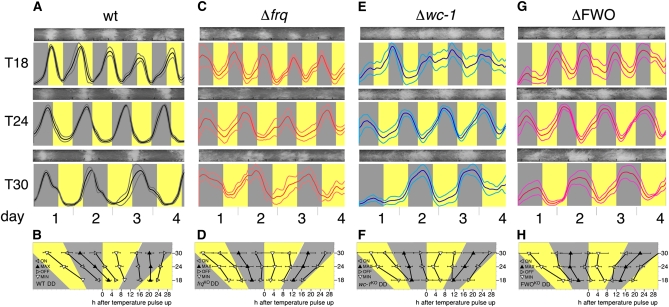
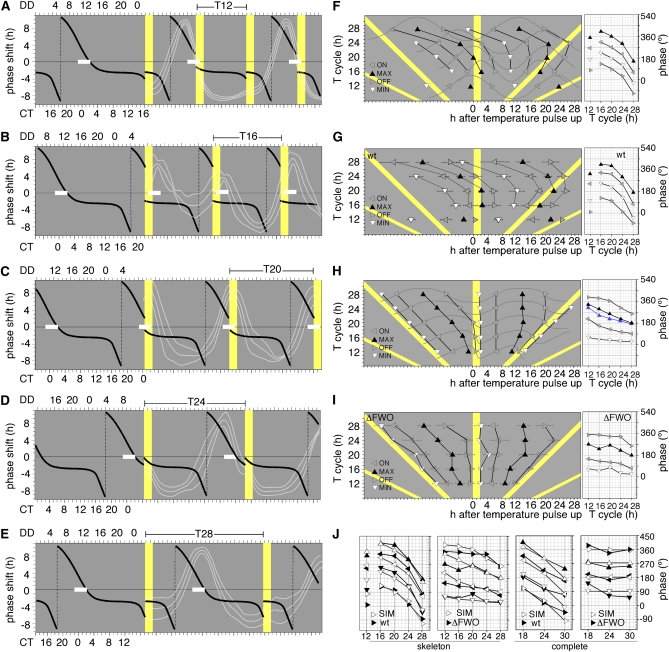
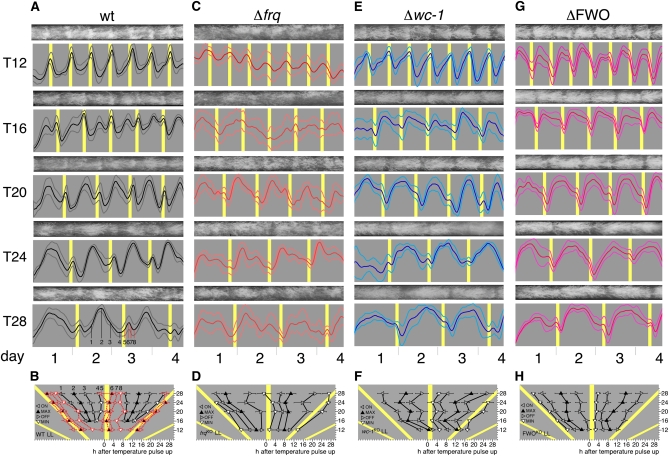
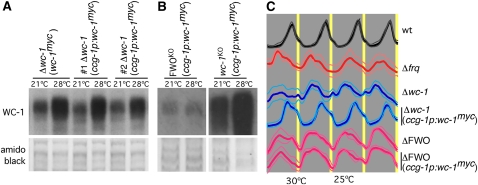
In Neurospora crassa, the interactions between products of the frequency (frq), frequency-interacting RNA helicase (frh), white collar-1 (wc-1), and white collar-2 (wc-2) genes establish a molecular circadian clockwork, called the FRQ-WC-Oscillator (FWO), which is required for the generation of molecular and overt circadian rhythmicity. In strains carrying nonfunctional frq alleles, circadian rhythms in asexual spore development (conidiation) are abolished in constant conditions, yet conidiation remains rhythmic in temperature cycles. Certain characteristics of these temperature-synchronized rhythms have been attributed to the activity of a FRQ-less oscillator (FLO). The molecular components of this FLO are as yet unknown. To test whether the FLO depends on other circadian clock components, we created a strain that carries deletions in the frq, wc-1, wc-2, and vivid (vvd) genes. Conidiation in this ΔFWO strain was still synchronized to cyclic temperature programs, but temperature-induced rhythmicity was distinct from that seen in single frq knockout strains. These results and other evidence presented indicate that components of the FWO are part of the temperature-induced FLO.


Figures

Figure 1
Figure 1
Creation and phenotypic characterization of a ΔFWO strain. (A) Crossing strategy used to generate a ΔFWO strain. All strains carry the ras-1bd mutation (not shown). (B) Extension rates of indicated strains in LL (open bars) and DD (shaded bars) at 25°. Error bars indicate ±1 SD. (C and D) Representative race-tube images from strains grown in DD and LL at 25°. (E and F). Race-tube images of wild-type (wt) and ΔFWO strains grown in the indicated temperature skeleton T cycles. The duration of each 28° temperature pulse was 2 hr. Shaded bars: 22°C; open bars: 28°.
Figure 2
Figure 2
Conidial rhythmicity in skeleton temperature T cycles. Conidiation of wild-type (wt) and clock mutant race-tube cultures grown for 4 days at the indicated temperature skeleton T cycles in constant darkness. (A) Representative race-tube images and densitometric traces for each T cycle of Neurospora wild type (wt). Gray: 22°; yellow: 30°. The duration of each 30° temperature pulse is 2 hr. Thick line: mean; thin lines: ±1 SD. (B) Graph showing the dependence of four phase markers on T-cycle length using race-tube traces shown above. The phase markers are onset (ON), offset (OFF), peaks (MAX), and troughs (MIN) of conidiation and recorded in hours following start of temperature pulse (see Materials and Methods for more detail). Gray: 22°; yellow: 30°. Error bars indicate ±1 SD. C–H show the same analysis for the indicated clock mutant strains.
Figure 3
Figure 3
Conidial rhythmicity in complete temperature T cycles. Rhythmic conidiation of wild type (wt) and clock mutant race-tube cultures grown for 4 days at the indicated complete temperature T cycles in constant darkness. (A) Representative race-tube images (top) and densitometric traces (bottom) of Neurospora wild-type (wt). Gray shading: 22°; yellow: 30°. Thick line: mean; thin lines: ±1 SD. (B) Graph showing the dependence of four phase markers on T-cycle length using race-tube traces shown above. The phase markers are onset (ON), offset (OFF), peaks (MAX), and troughs (MIN) of conidiation and recorded in hours following start of temperature pulse (see Materials and Methods for more detail). Gray: 22°; yellow: 30°. Error bars indicate ±1 SD. C–H show the same analysis for the indicated clock mutant strains.
Figure 4
Figure 4
Modeling rhythmicity in temperature T cycles. Prediction of the position of phase markers of entrained and hourglass-type rhythms in Neurospora wild-type and circadian clock mutants in skeleton temperature T cycles (A–E) An idealized Neurospora phase response curve (PRC, black) illustrates the phase-shifting effects (expressed in hours of phase advances/delays with respect to an unperturbed control) of temperature pulses (2-hr pulses of 30°) given at different circadian times (CT) during the Neurospora conidiation cycle. The PRC is based on published data (Hunt et al. 2007). The white bars illustrate the location of the peak of conidiation that is fixed with respect to the PRC. Peaks of conidiation are defined here to occur at ∼CT0. For entrainment to the various T cycles to occur, a 2-hr 30° temperature pulse will need to strike the PRC at time point(s) where the resulting phase shift is the FRP–T-cycle period. For example, in a T24 cycle and given a wild-type FRP of ∼22 hr, the temperature pulse needs to strike at ∼CT4 to achieve the required 22–24 hr = −2-h delay. Using the PRC shown, the modeled peaks of conidiation (white bars) are in excellent agreement with the actual experimental data (race-tube traces, white lines). (F and G) Simulated (F) and experimental (G) position of phase markers of conidial rhythms entrained to the shown T cycles. Conidial rhythms were simulated by simple sine waves, and the predicted phase markers are based on the PRC introduced above. Experimental data are derived from phase analysis of the race-tube data shown in Figure 2A. The phase markers shown were recorded in hours following the start of the temperature pulse (yellow) and represent onsets (ON), offsets (OFF), peaks (MAX), and troughs (MIN) of conidiation. The graphs on the right depict the dependence of a phase (expressed in degrees) on the T cycle. For experimental data, only the mean phases are shown. (H and I) Simulated hourglass-type behavior (H) and experimental data for the ΔFWO strain (I) in skeleton T cycles (see Figure 2G). The onset of the temperature pulse has two effects: it resets and it restarts an hourglass-type mechanism. In a T cycle that is shorter than the duration of the stimulus response (e.g., T20), the next temperature pulse suppresses spore development, and conidiation restarts at the end of the pulse. Phase markers and graphs are as described above. The data highlighted in blue in H are replotted from Lakin-Thomas (2006) and show peaks of conidiation of a wc-1 mutant strain (see Figure 3A). (J) Comparison of simulated (SIM, open symbols) and experimental (solid symbols, WT and ΔFWO) phase data from skeleton and complete temperature T cycles (also see Figure S3).
Figure 5
Figure 5
Conidial rhythmicity in skeleton temperature T cycles kept in constant light. Rhythmic conidiation of wild type (wt) and clock mutant race-tube cultures grown for 4 days at the indicated temperature skeleton T cycles in constant light. (A) Representative race-tube images (top) and densitometric traces (bottom) of Neurospora wild type (wt). Gray: 22°; yellow: 30°. The duration of each 28° temperature pulse is 2 hr. Thick line: mean; thin lines: ±1 SD. (B) Graph showing the dependence of four phase markers on T-cycle length using race-tube traces shown above. The phase markers are onset (ON), offset (OFF), peaks (MAX), and troughs (MIN) of conidiation and recorded in hours following start of temperature pulse (see Materials and Methods for more detail). Because two sets of peaks were easily discernible in the wild type, all of the associated phase markers (1–8, exemplified for T28 in A) were subjected to phase analysis and are shown in black (phase markers 1–4) or red (phase markers 5–8). Gray: 22°; yellow: 30°. Error bars indicate ±1 SD. (C–H) The same analysis for the indicated clock mutant strains. Phase markers were calculated only for the prominent rhythms of conidiation. Note that conidiation in a Δfrq grown in a T16 cycle was too erratic to yield reliable data on phase.
Figure 6
Figure 6
A functional WCC is required to rescue the temperature-entrained FLO. (A) Transgenic Δwc-1 strains at 21° and 28° in which wc-1myc expression is driven from the wc-1 (wc-1myc) or the ccg-1 promoter (ccg-1p:wc-1myc). (B) Transgenic ΔFWO and Δwc-1 strains at 21° and 28° with wc-1myc expression driven from the ccg-1 promoter (ccg-1p:wc-1myc). The amido black-stained membrane serves as a loading control. (C) Conidial rhythmicity in T24 skeleton temperature cycles of the indicated wild-type, clock-mutant, and transgenic Δwc-1 and ΔFWO strains.

Similar articles

Cited by

References

    1. Aronson B. D., Johnson K. A., Dunlap J. C., 1994. Circadian clock locus frequency: protein encoded by a single open reading frame defines period length and temperature compensation. Proc. Natl. Acad. Sci. USA 91: 7683–7687. - PMC - PubMed
    1. Belden W. J., Larrondo L. F., Froehlich A. C., Shi M., Chen C. H., et al. , 2007. The band mutation in Neurospora crassa is a dominant allele of ras-1 implicating RAS signaling in circadian output. Genes Dev. 21: 1494–1505. - PMC - PubMed
    1. Bell-Pedersen D., Cassone V. M., Earnest D. J., Golden S. S., Hardin P. E., et al. , 2005. Circadian rhythms from multiple oscillators: lessons from diverse organisms. Nat. Rev. Genet. 6: 544–556. - PMC - PubMed
    1. Bieszke J. A., Braun E. L., Bean L. E., Kang S., Natvig D. O., et al. , 1999. The nop-1 gene of Neurospora crassa encodes a seven transmembrane helix retinal-binding protein homologous to archaeal rhodopsins. Proc. Natl. Acad. Sci. USA 96: 8034–8039. - PMC - PubMed
    1. Bruce V. G., 1960. Environmental entrainment of circadian rhythms. Cold Spring Harb. Symp. Quant. Biol. 25: 29–48. - PubMed

Publication types