. 2012 May;191(1):247-59.
doi: 10.1534/genetics.111.135988. Epub 2012 Feb 23.

Genome scans for transmission ratio distortion regions in mice

Affiliations

Genome scans for transmission ratio distortion regions in mice

Joaquim Casellas et al. Genetics. 2012 May.

Abstract

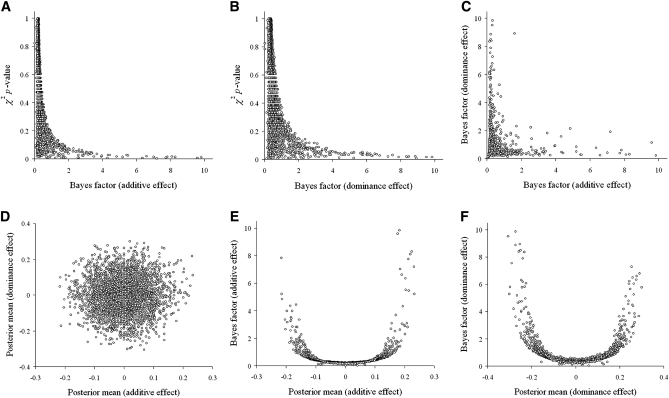
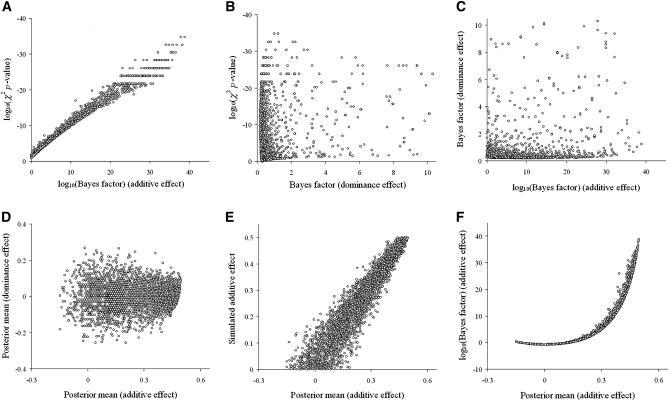
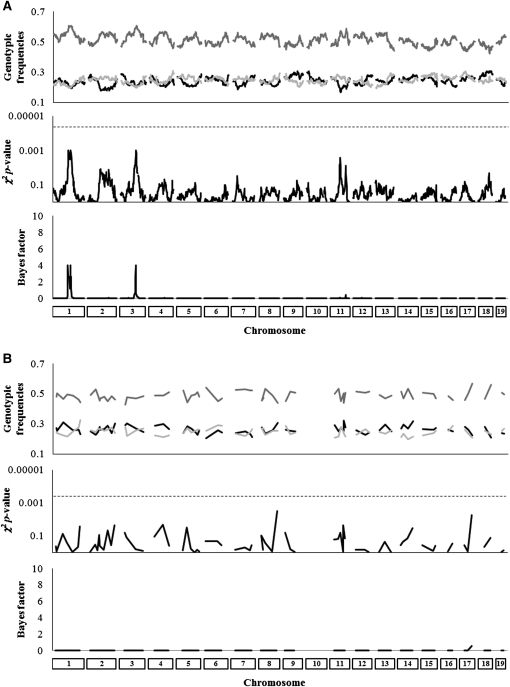
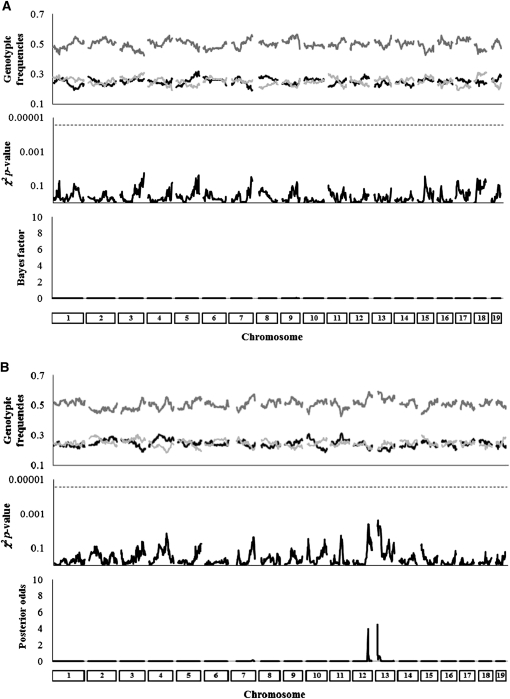
Transmission ratio distortion (TRD) is the departure from the expected genotypic frequencies under Mendelian inheritance. This departure can be due to multiple physiological mechanisms during gametogenesis, fertilization, fetal and embryonic development, and early neonatal life. Although a few TRD loci have been reported in mouse, inheritance patterns have never been evaluated for TRD. In this article, we developed a Bayesian binomial model accounting for additive and dominant deviation TRD mechanisms. Moreover, this model was used to perform genome-wide scans for TRD quantitative trait loci (QTL) on six F2 mouse crosses involving between 296 and 541 mice and between 72 and 1854 genetic markers. Statistical significance of each model was checked at each genetic marker with Bayes factors. Genome scans revealed overdominance TRD QTL located in mouse chromosomes 1, 2, 12, 13, and 14 and additive TRD QTL in mouse chromosomes 2, 3, and 15, although these results did not replicate across mouse crosses. This research contributes new statistical tools for the analysis of specific genetic patterns involved in TRD in F2 populations, our results suggesting a relevant incidence of TRD phenomena in mouse with important implications for both statistical analyses and biological research.


Figures

Figure 1
Figure 1
Performance of the Bayes factor (BF) for testing additive and dominance transmission ratio distortions (TRD) under null TRD departures. Stochastic simulation processes were used to generate 1000 populations with variable size ranging between 100 and 500 individuals. Genetic data were restricted to a single biallelic marker (alleles A1 and A2)with genotypic frequencies of 0.25 (A1A1), 0.5 (A1A2), and 0.25 (A2A2). For each population, genetic data were analyzed under the BF approach developed above and by launching a unique Monte Carlo Markov chain of 100,000 elements; the first 10,000 iterations were discarded as burn-in. Moreover, TRD was also tested by applying a standard χ2-test with 2 d.f. Pairwise relationships are plotted, involving four parameters from the Bayesian analysis, i.e., BFs for additive (elements A, C, and E) and dominance (elements B, C, and F) TRD and posterior means of the additive (elements D and E) and dominance (elements D and F) effects, as well as the P-value (elements A and B) derived from the frequentist χ2-test.
Figure 2
Figure 2
Performance of the Bayes factor (BF) for testing additive and dominance transmission ratio distortions (TRD) under additive TRD departures. Stochastic simulation processes were used to generate 1000 populations with 250 individuals each. Genetic data restricted to a single biallelic marker (alleles A1 and A2) and genotypic frequencies were generated under an additive TRD effect ranging from 0 to 0.5. For each population, genetic data were analyzed under the BF approach and by launching a unique Monte Carlo Markov chain of 100,000 elements; the first 10,000 iterations were discarded as burn-in. Moreover, TRD was also tested by applying a standard χ2-test with 2 d.f. Pairwise relationships are plotted, involving four parameters from the Bayesian analysis, i.e., BFs for additive (elements A, C, and F) and dominance (elements B and C) TRD and posterior means of the additive (elements D–F) and dominance (element D) effects, the P-value (elements A and B) derived from the frequentist χ2-test, and the simulated (i.e., real) additive TRD effect (element E).
Figure 3
Figure 3
Diagrams of transmission ratio distortion quantitative trait loci in C57BL/6J × CAST/EiJ (cross 1) (A) and C57BL/6Jhg/hg × CAST/EiJ (cross 2) (B) F2 crosses with 296 and 536 mice, respectively. (Top) Observed genotypic frequencies for C57BL/6J (or C57BL/6Jhg/hg) homozygous (solid line), heterozygous (line with dark shading), and CAST/EiJ homozygous (line with light shading) populations. (Middle) P-value from a SNP-by-SNP χ2-test with 2 d.f., evaluating the departure from the expected 0.25:0.5:0.25 genotypic frequencies in an F2 population (the horizontal dotted line shows the significance threshold after a Bonferroni correction with α = 0.05). (Bottom) Plot of the posterior odds (PO) for dominance transmission ratio distortion (i.e., parameter d). Note that the remaining TRD parameters did not provide >1 PO at any marker location in these mouse crosses.
Figure 4
Figure 4
Diagrams of transmission ratio distortion quantitative trait loci in C57BL/6J × C3H/HeJ (cross 3) (A) and B6.apoE−/− × C3H.apoE−/− (cross 4) (B) F2 crosses with 209 and 322 mice, respectively. (Top) Observed genotypic frequencies for C3H/HeJ (or C3H.apoE−/−) homozygous (solid line), heterozygous (line with dark shading), and C57BL/6J (or B6.apoE−/−) homozygous (line with light shading) populations. (Middle) P-value from a SNP-by-SNP χ2-test with 2 d.f., evaluating the departure from the expected 0.25:0.5:0.25 genotypic frequencies in an F2 population (the horizontal dotted line shows the significance threshold after a Bonferroni correction with α = 0.05). (Bottom) Plot of the posterior odds (PO) for dominance transmission ratio distortion (i.e., parameter d). Note that the remaining TRD parameters did not provide >1 PO at any marker location in these mouse crosses.
Figure 5
Figure 5
Diagrams of transmission ratio distortion quantitative trait loci in two C57BL/6ob/ob × BTBRob/ob F2 crosses with 477 (cross 5) (A) and 541 mice (cross 6) (B), respectively. (Top) Observed genotypic frequencies for BTBRob/ob homozygous (solid line), heterozygous (line with dark shading), and C57BL/6ob/ob homozygous (line with light shading) populations. (Middle) P-value from a SNP-by-SNP χ2-test with 2 d.f., evaluating the departure from the expected 0.25:0.5:0.25 genotypic frequencies in an F2 population (the horizontal dotted line shows the significance threshold after a Bonferroni correction with α = 0.05). (Bottom) Plots of the posterior odds (PO) for the dominance (A) and additive (B) transmission ratio distortion (i.e., parameters d and a, respectively). Note that the remaining models did not provide >1 PO at any marker location in these mouse crosses.

Similar articles

Cited by

References

    1. Agulnik S. I., Agulnik A. I., Ruvinsky A. O., 1990. Meiotic drive in female mice heterozygous for the HSR insert on chromosome 1. Genet. Res. 55: 97–100. - PubMed
    1. Bonferroni C. E., 1930. Elementi di Statistica Generale. Libreria Seber, Florence, Italy.
    1. Bruce A. B., 1910. The Mendelian theory of heredity and the augmentation of vigor. Science 32: 627–628. - PubMed
    1. Canham R. P., Birdsall D. A., Cameron D. G., 1970. Disturbed segregation at the transferring locus of the deer mouse. Genet. Res. 16: 355–377. - PubMed
    1. Casellas J., Medrano J. F., 2008. Within-generation mutation variance for litter size in inbred mice. Genetics 179: 2147–2155. - PMC - PubMed

Publication types