. 2012 Mar-Apr;33(2):231-8.
doi: 10.1097/AUD.0b013e31823173fd.

Neural encoding and perception of speech signals in informational masking

Affiliations

Neural encoding and perception of speech signals in informational masking

Keri O'Connell Bennett et al. Ear Hear. 2012 Mar-Apr.

Erratum in

  • Ear Hear. 2012 May;33(3):436

Abstract

Objective: To investigate the contributions of energetic and informational masking to neural encoding and perception in noise, using oddball discrimination and sentence recognition tasks.

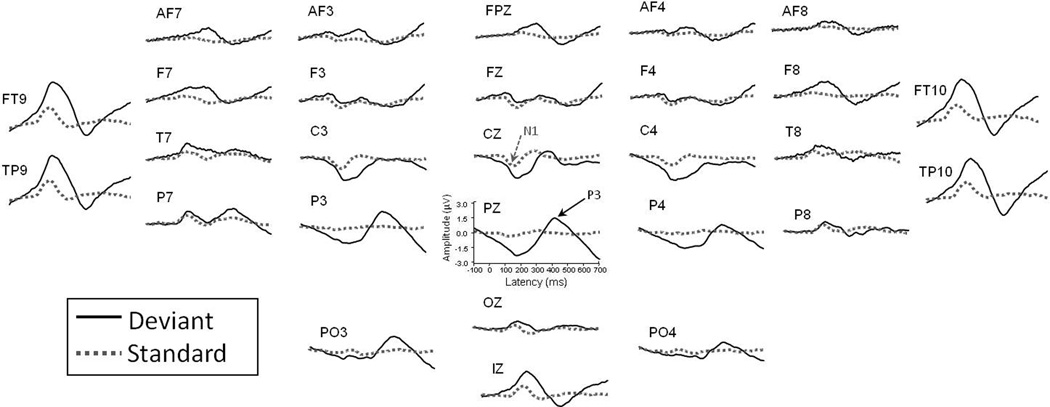
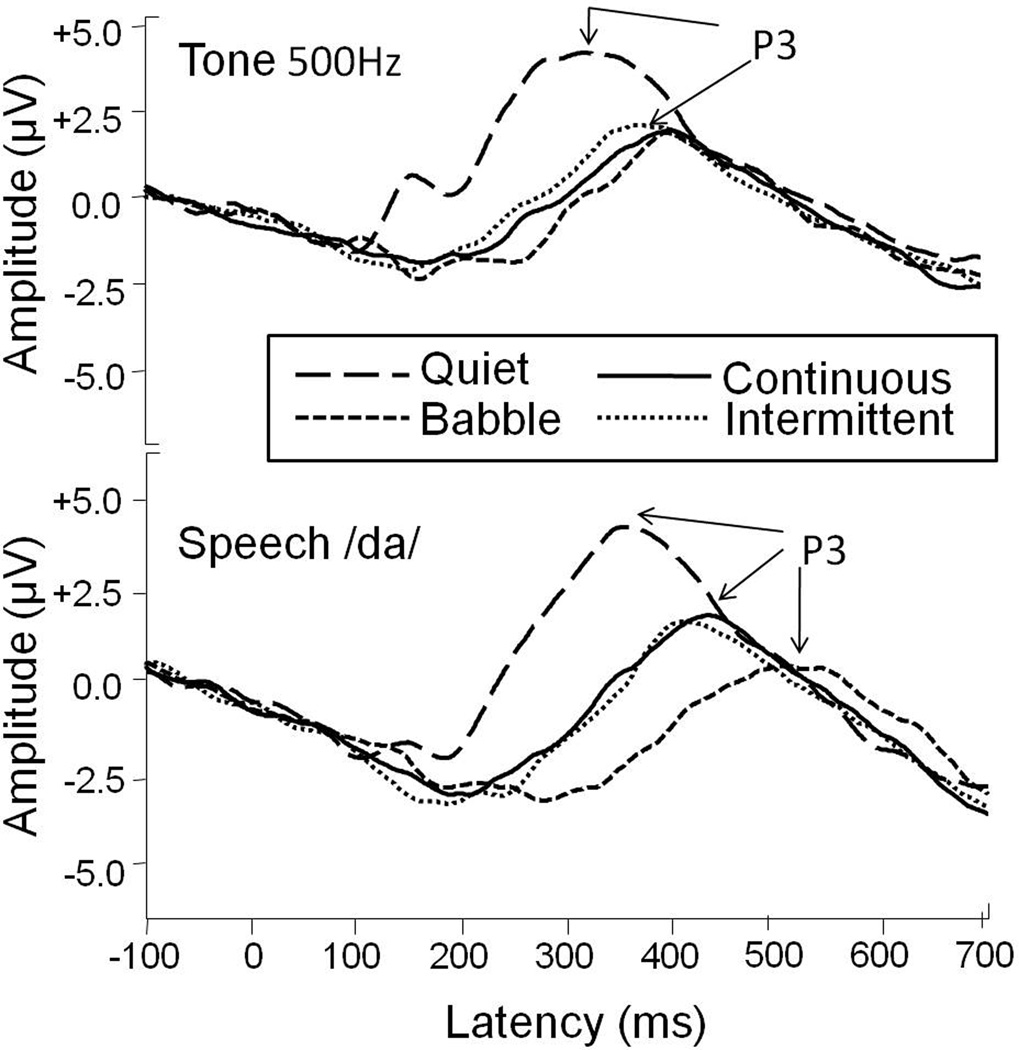
Design: P3 auditory evoked potential, behavioral discrimination, and sentence recognition data were recorded in response to speech and tonal signals presented to nine normal-hearing adults. Stimuli were presented at a signal to noise ratio of -3 dB in four background conditions: quiet, continuous noise, intermittent noise, and four-talker babble.

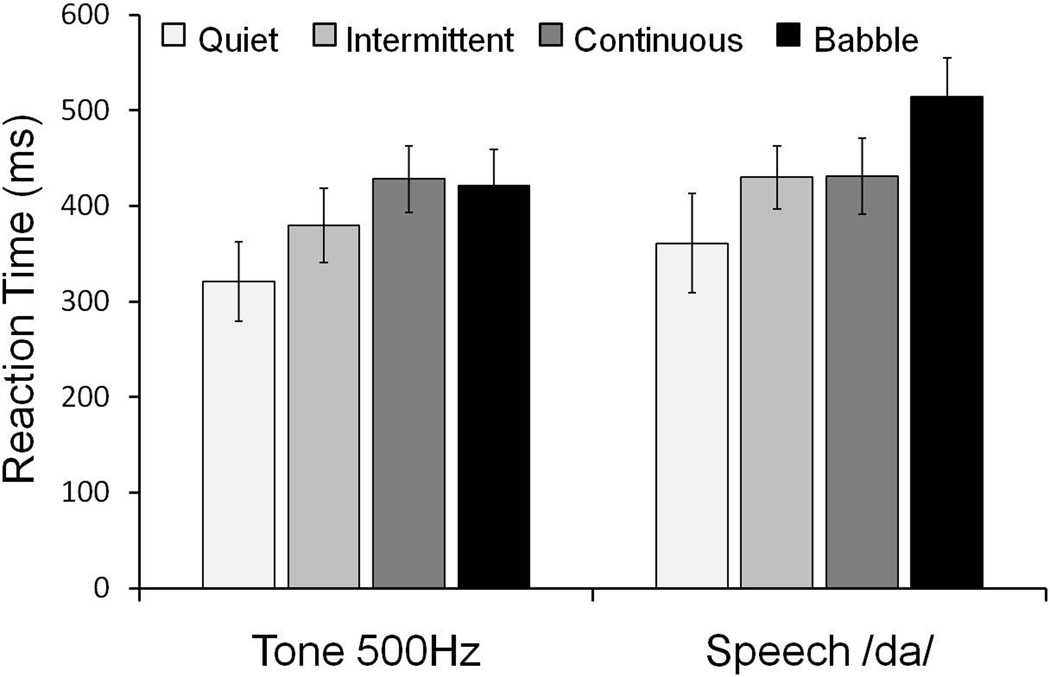
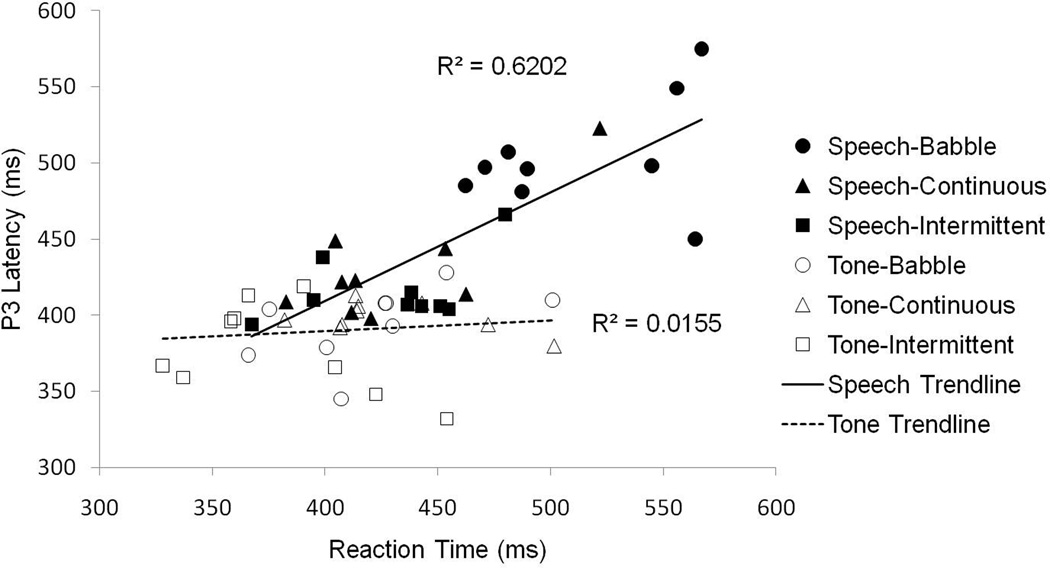
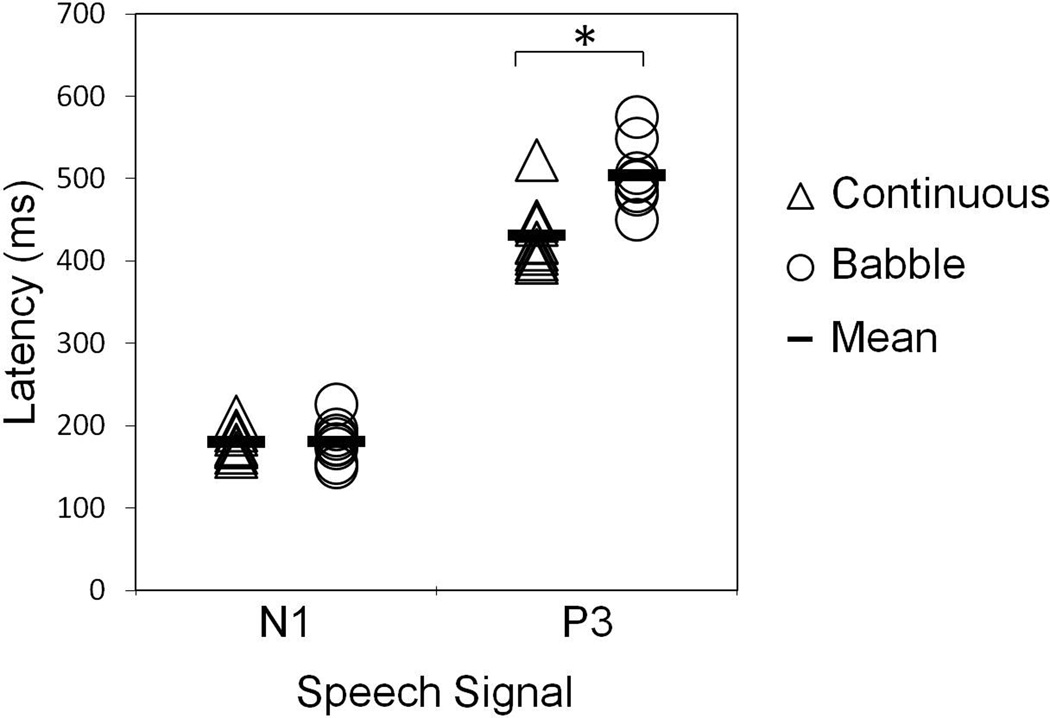
Results: Responses to tonal signals were not significantly different for the three maskers. However, responses to speech signals in the four-talker babble resulted in longer P3 latencies, smaller P3 amplitudes, poorer discrimination accuracy, and longer reaction times than in any of the other conditions. Results also demonstrate significant correlations between physiological and behavioral data. As latency of the P3 increased, reaction times also increased and sentence recognition scores decreased.

Conclusion: The data confirm a differential effect of masker type on the P3 and behavioral responses and present evidence of interference by an informational masker to speech understanding at the level of the cortex. Results also validate the use of the P3 as a useful measure to demonstrate physiological correlates of informational masking.


Figures

Figure 1
Figure 1
Grand average waveforms for a subset of electrode sites demonstrate scalp topography differences between the deviant and standard waveforms obtained from the oddball paradigm. Waveforms are collapsed across signals (tone and speech) and masker type (continuous, intermittent, babble). At the Pz electrode position a robust P3 peak is present in response to the deviant signals (500Hz and /da/), whereas the N1 peak, in response to the standard signals (1000Hz and /ba/) is most robust at the Cz electrode. Electrode sites of TP9, TP10, FT9, FT10 and Iz depict inversion waveforms.
Figure 2
Figure 2
Grand average P3 response waveforms in quiet and masker conditions (intermittent, continuous, babble) to the deviant targets: 500 Hz tone (top) and the /da/ speech syllable (bottom). Responses are displayed for electrode Pz. Arrows mark approximate P3 peaks for the quiet and masker conditions. This graph shows robust responses in quiet and degraded responses (increased latency and decreased amplitude) under masking conditions. Speech-on-speech masking (/da/ presented in babble) results in the largest latency delays and amplitude reductions.
Figure 3
Figure 3
Reaction time for the oddball discrimination task in quiet and masker conditions (intermittent, continuous, babble) with standard error of the mean. This bar graph displays prolonged reaction time for the speech /da/ condition as compared to the 500Hz tone condition. In addition, the longest reaction time is apparent for the speech-on-speech condition (/da/ in babble).
Figure 4
Figure 4
Percent correct scores for the oddball discrimination and sentence recognition tasks in quiet and masker conditions (intermittent, continuous, babble) for the three target signals: 500 Hz tone, /da/ speech syllable, and sentences, with standard error of the mean. This graph shows the poorest percent correct recognition for the speech-on-speech condition (/da/ in babble). The discrimination results depicted are PC(Max, yes/no) scores.
Figure 5
Figure 5
Individual data points were coded by masker type (intermittent, continuous, babble) and plotted to display the relationship between the behavioral sentence-in-noise scores (% correct) and P3 latency measures (ms) for the /da/ speech syllable and the 500 Hz tone signals. Linear lines of best fit reveal a strong negative correlation between the physiological and behavioral measures for speech. Higher percent correct scores are associated with shorter P3 latencies.
Figure 6
Figure 6
Individual data points were coded by masker type (intermittent, continuous, babble) and plotted to display the relationship between reaction time (ms) and P3 latency (ms) for speech /da/ and 500 Hz tone signals. Linear lines of best fit reveal a significant positive correlation between the physiological and behavioral measures for speech. Longer reaction times are associated with longer P3 latencies.
Figure 7
Figure 7
Individual N1 latency values (reported by Billings et al., 2011) for the standard speech signal (/ba/) and the individual P3 latency values (in the current study) for the deviant speech signal (/da/), in the continuous and babble masker types. This figure displays the effects of an informational masker (babble) as compared to an energetic masker (continuous) on latency measures of the N1 and P3 peaks. There is a significant difference in mean latency values between the continuous and babble masker types for the P3 peak. This difference between masker type is not present in the obligatory N1 peak latency measures.

References

    1. Androulidakis AG, Jones SJ. Detection of signals in modulated and unmodulated noise observed using auditory evoked potentials. Clin Neurophysiol. 2006;117:1783–1793. - PubMed
    1. American Speech-Language Hearing Association (ASHA) Guidelines for screening for hearing impairments and middle ear disorders. ASHA. 1990;32 Suppl 2:17–24. - PubMed
    1. Billings CJ, Bennett KO, Molis MR, et al. Cortical encoding of signals in noise: effects of stimulus type and recording paradigm. Ear Hear. 2011;32(1):53–60. - PMC - PubMed
    1. Billings CJ, Tremblay KL, Stecker GC, et al. Human evoked cortical activity to signal-to-noise ratio and absolute signal level. Hear Res. 2009;254:15–24. - PMC - PubMed
    1. Dubno JR, Schaefer AB. Comparison of frequency selectivity and consonant recognition among hearing-impaired and masked normal-hearing listeners. J Acoust Soc Am. 1992;91:2110–2121. - PubMed

Publication types