. 2012 May;22(5):870-84.
doi: 10.1101/gr.130740.111. Epub 2012 Feb 23.

Mouse endogenous retroviruses can trigger premature transcriptional termination at a distance

Affiliations

Mouse endogenous retroviruses can trigger premature transcriptional termination at a distance

Jingfeng Li et al. Genome Res. 2012 May.

Abstract

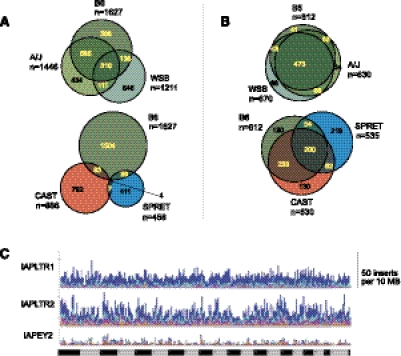
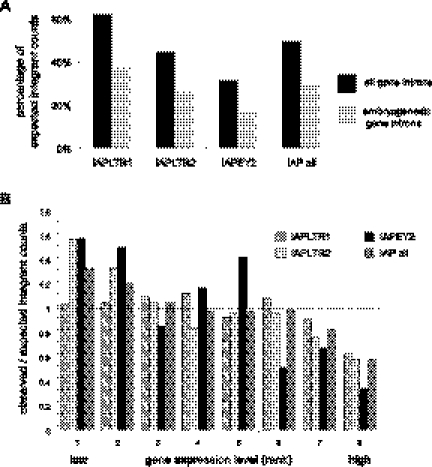
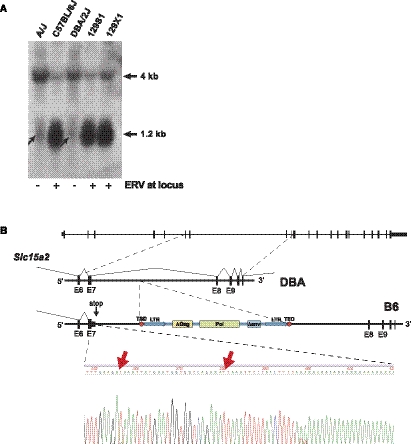
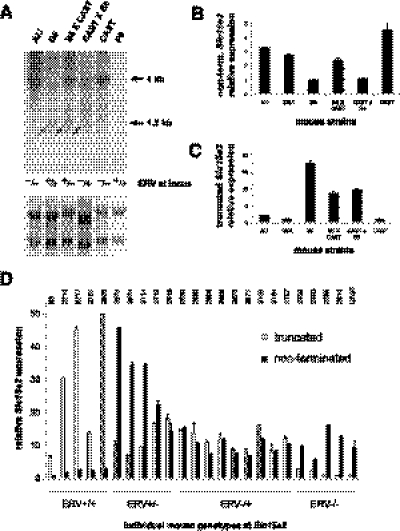
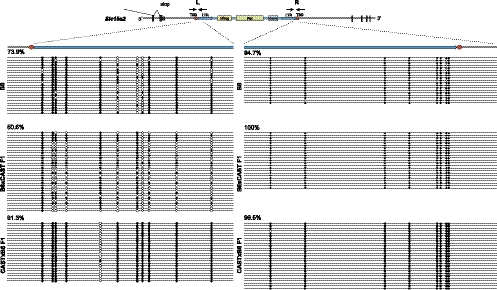
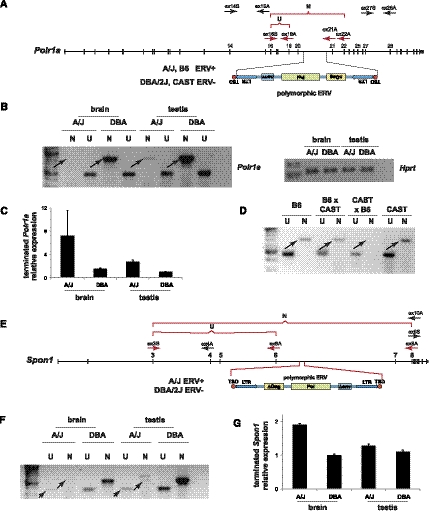
Endogenous retrotransposons have caused extensive genomic variation within mammalian species, but the functional implications of such mobilization are mostly unknown. We mapped thousands of endogenous retrovirus (ERV) germline integrants in highly divergent, previously unsequenced mouse lineages, facilitating a comparison of gene expression in the presence or absence of local insertions. Polymorphic ERVs occur relatively infrequently in gene introns and are particularly depleted from genes involved in embryogenesis or that are highly expressed in embryonic stem cells. Their genomic distribution implies ongoing negative selection due to deleterious effects on gene expression and function. A polymorphic, intronic ERV at Slc15a2 triggers up to 49-fold increases in premature transcriptional termination and up to 39-fold reductions in full-length transcripts in adult mouse tissues, thereby disrupting protein expression and functional activity. Prematurely truncated transcripts also occur at Polr1a, Spon1, and up to ∼5% of other genes when intronic ERV polymorphisms are present. Analysis of expression quantitative trait loci (eQTLs) in recombinant BxD mouse strains demonstrated very strong genetic associations between the polymorphic ERV in cis and disrupted transcript levels. Premature polyadenylation is triggered at genomic distances up to >12.5 kb upstream of the ERV, both in cis and between alleles. The parent of origin of the ERV is associated with variable expression of nonterminated transcripts and differential DNA methylation at its 5'-long terminal repeat. This study defines an unexpectedly strong functional impact of ERVs in disrupting gene transcription at a distance and demonstrates that ongoing retrotransposition can contribute significantly to natural phenotypic diversity.


Figures

Figure 1.
Figure 1.
Genomic variation due to ERVs in diverse mouse strains. (A,B) Venn diagrams indicating counts (n) of shared versus distinct ERV elements at individual integration sites (orthologous locations) in previously unsequenced mouse strains. The youngest IAPLTR1 (A) and older IAPEY2 (B) elements were compared at genomic insertion sites in related B6, A/J, and WSB (top) and in divergent B6, CAST, and SPRET (bottom) mouse strains. MOLF integrants are not presented here. Only four of several thousand youngest IAP integrants occur at orthologous loci in the most divergent strains (lower left). (C) Genome-wide distributions of ERV polymorphisms in diverse mouse lineages. Histograms display the numbers of strains containing polymorphic ERVs at orthologous loci within 10-MB genomic bins for (top) IAPLTR1; (middle) IAPLTR2; and (bottom) IAPEY2 elements. (Dark blue) Integrants present in one strain; (light blue) two strains; (purple) three; (light pink) four; (orange) five; (red) all six. (Bottom) Mouse chromosomes 1–19, X, and Y (alternating shading).
Figure 2.
Figure 2.
Young ERVs are excluded from introns, particularly from embryogenesis and highly expressed genes. (A) “Observed” ERV integrant counts are plotted as percentages of “expected” counts within all gene introns (black histograms) or embryogenesis genes (gray). Genomic locations of various classes of ERVs (x-axis) were identified in diverse mouse lineages. Expected counts were determined by random simulation of 2 million insertion sites across the reference genome. By chance, ∼35% of ERV insertions would be expected to fall within RefSeq gene introns, and ∼2.7% of all insertions would fall within embryogenesis genes, defined by the Mouse Genome Informatics database (http://www.informatics.jax.org). This normalization corrects for gene lengths. Percentages <100% signify relative exclusion of certain ERV subtypes from particular gene categories. (B) Based on their expression levels in mouse ES cells measured by microarrays (Mikkelsen et al. 2007), genes were binned into eight groups ranked from 1 (lowest expression) to 8 (highest), each with roughly equivalent numbers of genes expressed at comparable levels. Ratios of the observed numbers of genes containing intronic ERV integrants versus the expected number of genes identified by random simulation are presented (Brady et al. 2009) for different classes of ERV integrants (key, upper right). (Dashed line) Ratio = 1 signifies equivalence between observed and expected counts; ratios < 1 signify relative exclusion of ERV integrants from particular groups of genes.
Figure 3.
Figure 3.
An intronic ERV polymorphism disrupts Slc15a2 expression and function. (A) Northern blots. Equivalent amounts (10 mcg each) of total RNAs from brains pooled from several individuals from the indicated lineages were electrophoresed. Northern blots were probed with 5′ (left) and 3′ (right) probes from Slc15a2. (Left) Truncated transcripts (1.2 kb, arrow) correlate with the presence of a polymorphic ERV in B6, 129S1, and 129X1 strains but absent from the others. The full-length (nonterminated, 4 kb) Slc15a2 transcript is expressed robustly in the absence of the ERV integrant in A/J and DBA mice. (Right) No appreciable downstream fusion transcript (2 kb) was detected, although it was identified by qRT-PCR (data not shown). Loading controls are shown in Supplemental Figure 3A. (B) Western blots. Protein extracts from individual brains (left) and lungs (right) from B6 and DBA mice were electrophoresced and probed for PEPT2 using protein-specific antiserum. (C) Functional assay in vivo. Accumulation of radiolabeled Gly-Sar dipeptide substrate was measured in choroid plexus and lung from B6 versus DBA mouse lineages, indicating significantly different PEPT2 functional activities (asterisks).
Figure 4.
Figure 4.
Transcriptional termination occurs at pre-existing signal upstream of ERV. (A) Prematurely terminated transcripts are present at low levels (arrows) in kidneys of mouse strains lacking the polymorphic ERV, indicating that the premature transcriptional polyadenylation signal exists both in strains that have or lack the ERV, and is not templated by the ERV per se. (B, top) Schematic of the Slc15a2 locus showing site of premature transcriptional termination ∼1.5 kb upstream of the intronic ERV polymorphism present in the B6 strain, in intron 7. (Bottom) Sequence trace from 3′-RACE experiment, demonstrating that the 3′ end of the prematurely truncated transcript is polyadenylated ∼1.5 kb upstream of the ERV and contains no ERV-templated sequences per se. (Red arrows) Weak pre-existing polyadenylation signals (i.e., 5′-GATAAA and ATTAAA) are present in the intron, immediately upstream of the added poly(A) tail. GenBank accession numbers JF495121–JF495122.
Figure 5.
Figure 5.
Strong genetic associations between transcriptional disruption and ERVSlc15a2 status in cis. (A) eQTL permutation analysis indicates a very strong association between a SNP (rs4173858) genotype, which serves as a surrogate for ERVSlc15a2 ∼ 137 kb distant, and expression of the Slc15a2 truncated transcript in mouse recombinant inbred BxD strain kidneys. (Red line) The chromosomal position of Slc15a2; (y-axis) P-values were calculated for the association between each SNP at the indicated chromosomal coordinates and truncated Slc15a2 transcript levels. (B, top) Schematic of Affymetrix microarray probe sets detecting (1, 2) truncated or (3) full-length transcripts. (Bottom) Individual expression data (x-axis, log scale) measured by microarray probe sets (1–3) for each recombinant inbred BxD strain with indicated SNP genotypes: (red) B6; (blue) DBA; (black) heterozygous or indeterminate. (C) Box plots showing log of transcript expression versus genotypes: (B) B6; (D) DBA/2J. Error bars indicate SD. P-values for expression differences between genotypes B and D were calculated using a t-test: probe 1 = 1.80 × 10⁻²²; probe 2 = 5.53 × 10⁻²³, and probe 3 = 4.58 × 10⁻¹⁰.
Figure 6.
Figure 6.
Transcriptional termination occurs between alleles in F1 and F2 mice. (A, top) Northern blot demonstrating differential reduction in full-length transcripts in brains from CAST × B6 but not B6 × CAST F1 hybrid with heterozygous ERV integrants. In contrast, truncated transcripts (arrows) are detected in both lineages. (Bottom) Loading control showing 28S and 18S rRNA. Comparable amounts (10 mcg) of total RNA were loaded in each lane. (B) Quantitative RT-PCR assay for full-length transcripts (extending past exon 7) in brains from various mouse strains. Results are expressed as the fold change in levels relative to the sample with the lowest concentration. (C) Quantitative RT-PCR assay for the 3′ end of prematurely truncated transcripts shows that their expression is boosted specifically in strains containing ERVSlc15a2. (D) Quantitative RT-PCR assays for full-length and prematurely terminated transcripts (each in duplicate or triplicate) in individual mice with indicated genotypes. Results were normalized to Hprt (i.e., hypoxanthine guanine phosphoribosyl transferase) transcript expression. (Error bars) Range of data. Numbers at top are identifiers for individual mice (Supplemental Table 3).
Figure 7.
Figure 7.
Differential methylation at ERVSlc15a2 reflects its parent of origin. DNA methylation at left (L) 5′ and right (R) 3′ LTRs of ERVSlc15a2 was assessed using bisulfite sequencing of genomic DNA purified from brains of indicated mouse lineages. (Top, schematic) In amplicon L, primers DES2652 and DES4883 yielded a 272-nt genomic DNA fragment to assess the methylation status of 11 CpG dinucleotides (circles) presented for multiple cloned alleles (horizontal lines). In amplicon R, primers DES4881 and DES2649 yielded a 304-nt fragment to assess eight CpGs. (Filled circles) Methylated cytosine; (open) unmethylated. (Upper left corner of each panel) Percentages of cytosines that are methylated.
Figure 8.
Figure 8.
Disruption of additional genes by polymorphic, intronic ERVs in either orientation. (A) Genome structure of Polr1a containing a polymorphic AS ERV in intron 20, present in A/J and B6 and absent from DBA/2J and CAST mice. Various PCR primers are shown; (ex) exon number; (S) sense; (A) antisense. (Red arrows and brackets) cDNA amplicons; (U) upstream; (N) nonterminated, i.e., full-length. (B) Premature Polr1a termination occurs in brain and testis of A/J but not DBA mice. RT-PCR assays measured expression of upstream (U) versus nonterminated (N) transcripts, using ex16S and ex19A versus ex16S and ex22A primers, respectively. (Arrows) Differentially expressed, nonterminated transcripts. (Right) Loading control for spliced Hprt transcript assayed by RT-PCR. (C) Quantitative RT-PCR assay measuring relative differences between upstream and downstream Polr1a transcript levels, i.e., prematurely terminated transcripts. (Error bars) Range of duplicates. (D) Parent-of-origin effect on nonterminated Polr1a transcript levels in heterozygous mice. RT-PCR assays measured expression of upstream (U) vs. nonterminated (N) transcripts, using ex16S and ex19A versus ex16S and ex21A primers, respectively. (Arrows) Differentially expressed, nonterminated transcripts. See Supplemental Figure 6. (E) Genomic structure of Spon1 containing a polymorphic ERV in intron 6, present in A/J but not DBA mice. (F) Premature Spon1 termination in brain and testis of A/J but not DBA mice. (Arrows) Differentially expressed, upstream (U) and nonterminated (N) transcripts shown by RT-PCR assays. Both upstream and particularly full-length Spon1 transcripts are reduced in A/J mice (based on similar input RNA levels vs. DBA mice). (G) Quantitative RT-PCR assay measuring relative differences between upstream and downstream Spon1 transcript levels, i.e., prematurely terminated transcripts. (Error bars) Range of duplicates.

Similar articles

Cited by

References

    1. Adams DJ, Dermitzakis ET, Cox T, Smith J, Davies R, Banerjee R, Bonfield J, Mullikin JC, Chung YJ, Rogers J, et al. 2005. Complex haplotypes, copy number polymorphisms and coding variation in two recently divergent mouse strains. Nat Genet 37: 532–536 - PubMed
    1. Akagi K, Li J, Stephens RM, Volfovsky N, Symer DE 2008. Extensive variation between inbred mouse strains due to endogenous L1 retrotransposition. Genome Res 18: 869–880 - PMC - PubMed
    1. Akagi K, Stephens RM, Li J, Evdokimov E, Kuehn MR, Volfovsky N, Symer DE 2010. MouseIndelDB: A database integrating genomic indel polymorphisms that distinguish mouse strains. Nucleic Acids Res 38: D600–D606 - PMC - PubMed
    1. Banno F, Kaminaka K, Soejima K, Kokame K, Miyata T 2004. Identification of strain-specific variants of mouse Adamts13 gene encoding von Willebrand factor-cleaving protease. J Biol Chem 279: 30896–30903 - PubMed
    1. Barr SD, Leipzig J, Shinn P, Ecker JR, Bushman FD 2005. Integration targeting by avian sarcoma-leukosis virus and human immunodeficiency virus in the chicken genome. J Virol 79: 12035–12044 - PMC - PubMed

Publication types

MeSH terms

Substances

Associated data