. 2012 Jun;47(2):219-33.
doi: 10.1007/s12031-012-9722-8. Epub 2012 Feb 25.

Differential degradation of full-length and cleaved ataxin-7 fragments in a novel stable inducible SCA7 model

Affiliations

Differential degradation of full-length and cleaved ataxin-7 fragments in a novel stable inducible SCA7 model

Xin Yu et al. J Mol Neurosci. 2012 Jun.

Abstract

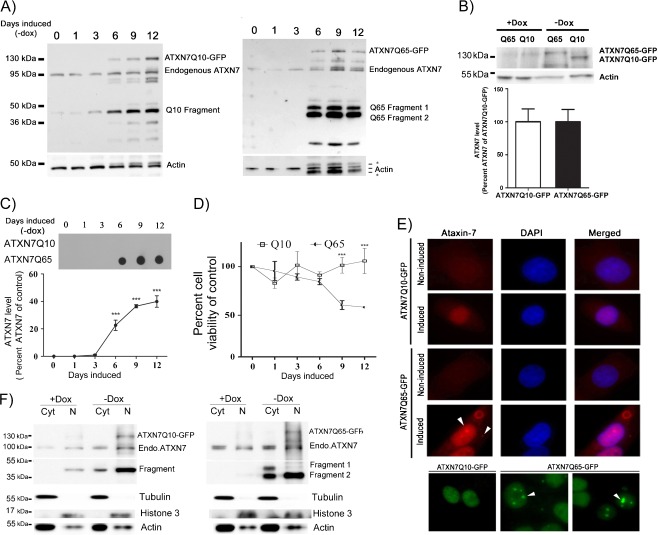
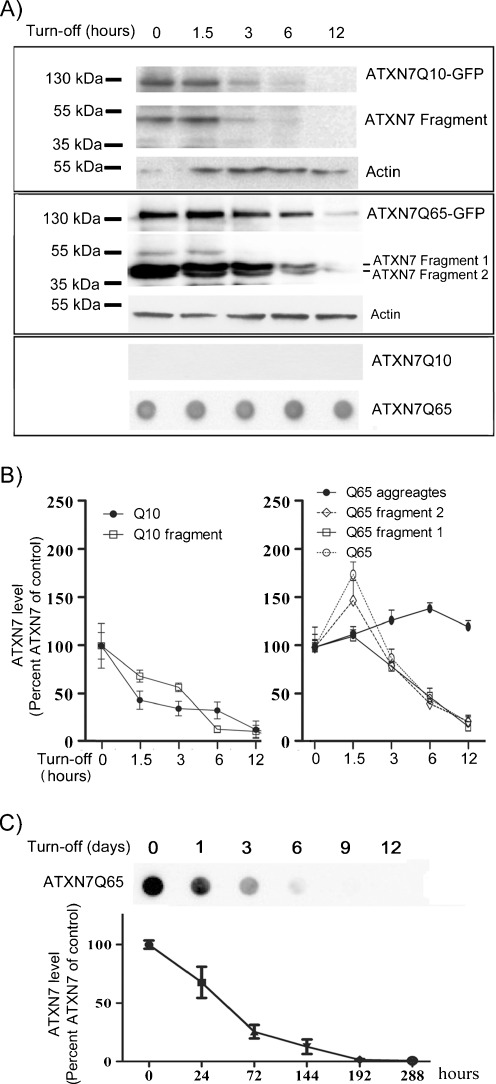
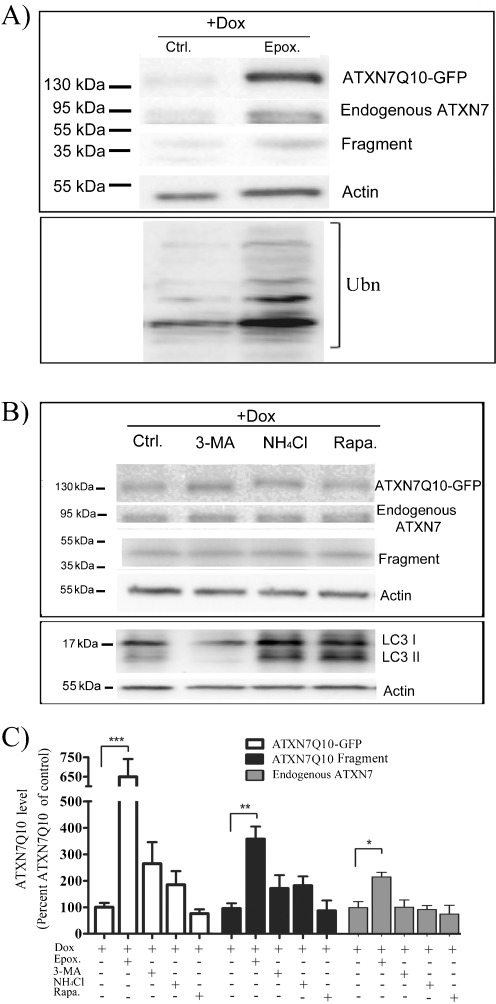
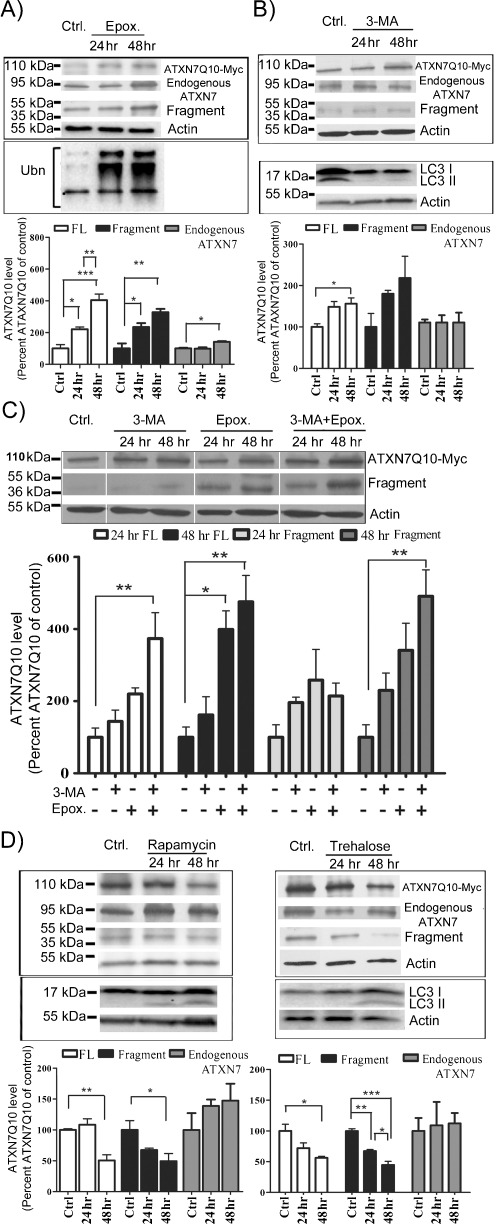
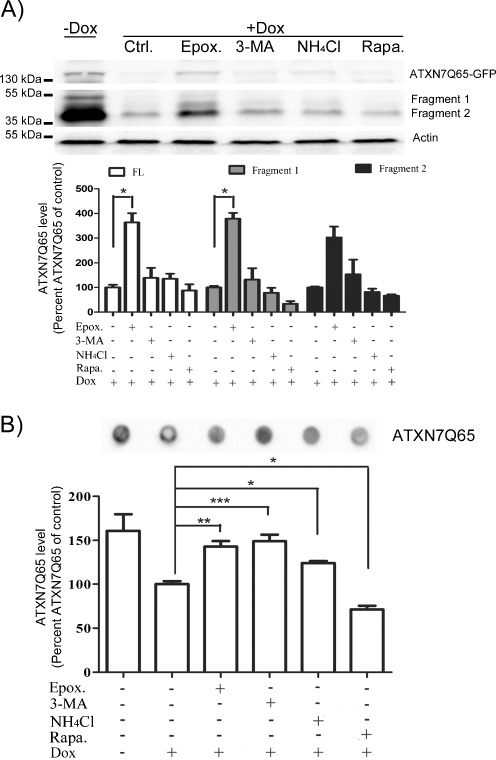
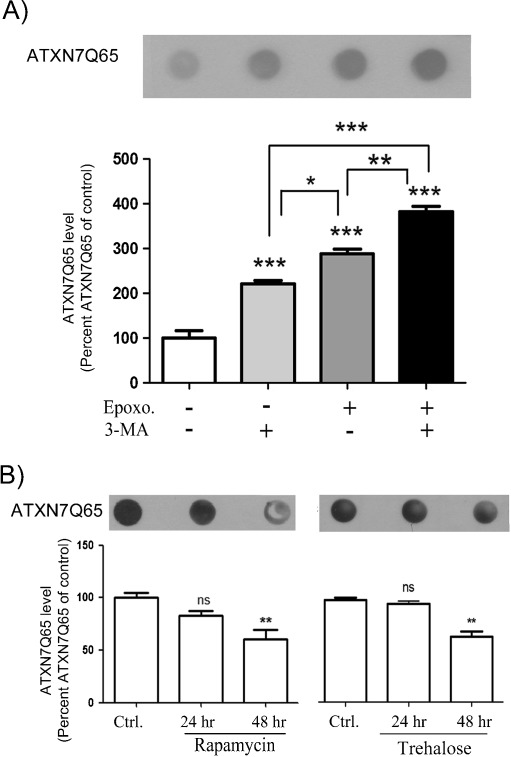
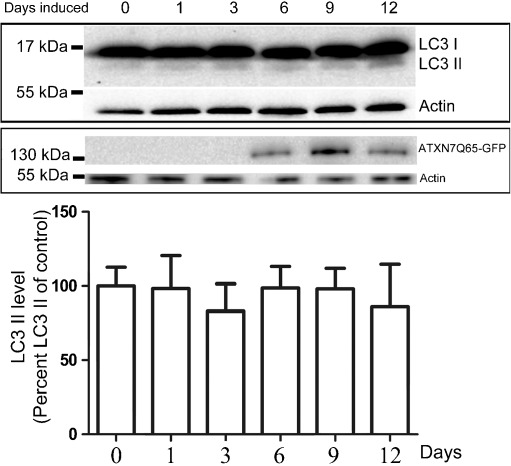
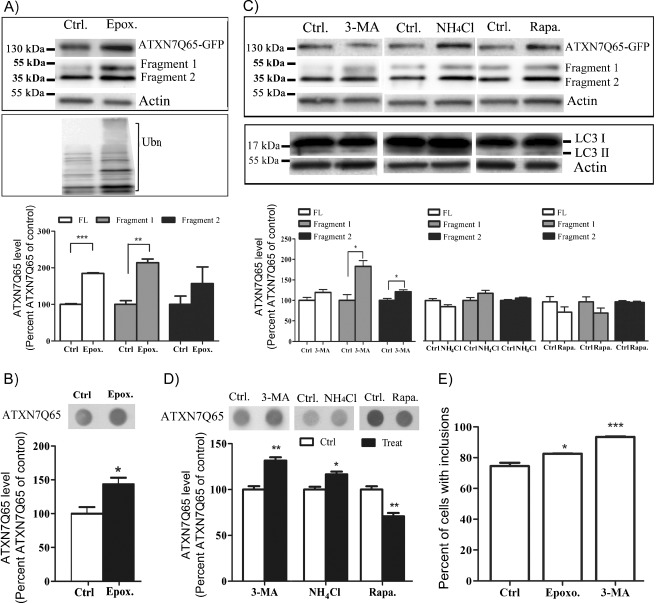
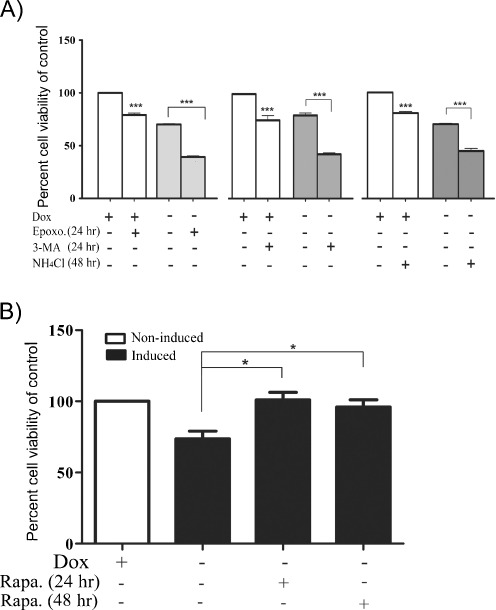
Spinocerebellar ataxia type 7 (SCA7) is one of nine neurodegenerative disorders caused by expanded polyglutamine repeats, and a common toxic gain-of-function mechanism has been proposed. Proteolytic cleavage of several polyglutamine proteins has been identified and suggested to modulate the polyglutamine toxicity. In this study, we show that full-length and cleaved fragments of the SCA7 disease protein ataxin-7 (ATXN7) are differentially degraded. We found that the ubiquitin-proteosome system (UPS) was essential for the degradation of full-length endogenous ATXN7 or transgenic full-length ATXN7 with a normal or expanded glutamine repeat in both HEK 293T and stable PC12 cells. However, a similar contribution by UPS and autophagy was found for the degradation of proteolytically cleaved ATXN7 fragments. Furthermore, in our novel stable inducible PC12 model, induction of mutant ATXN7 expression resulted in toxicity and this toxicity was worsened by inhibition of either UPS or autophagy. In contrast, pharmacological activation of autophagy could ameliorate the ATXN7-induced toxicity. Based on our findings, we propose that both UPS and autophagy are important for the reduction of mutant ataxin-7-induced toxicity, and enhancing ATXN7 clearance through autophagy could be used as a potential therapeutic strategy in SCA7.


Figures

Fig. 1
Fig. 1
Mutant ATXN7 aggregates and causes toxicity in a stable inducible PC12 cell model. a Expression of GFP-tagged ATXN7 with 10 (ATXN7Q10-GFP, left panel) or 65 (ATXN7Q65-GFP, right panel) glutamines after induction (doxycycline removal) of FLQ10 and FLQ65 stable PC12 cell lines for the indicated number of days. Western blot analysis using an ATXN7 antibody detected endogenous ATXN7, the respective full-length transgenic proteins and cleaved ATXN7 fragments. Actin was used as loading control. Asterisk indicates background from previous probing. b The expression level of ATXN7Q10-GFP and ATXN7Q65-GFP is not statistically different in FLQ10 and FLQ65 cells 12 days after induction. Actin was used for normalization and quantifications were done from three independent experiments. c Analysis of ATXN7 aggregation. Cells induced to express ATXN7Q10-GFP or ATXN7Q65-GFP for the indicated numbers of days were harvested and RIPA insoluble fractions were subjected to filter trap assay. d Viability of FLQ10 and FLQ65 cells induced to express ATXN7Q10-GFP or ATXN7Q65-GFP for the indicated number of days. Viability was measured by WST-1 assay and normalized against the protein content. e Microscopic analysis of ATXN7 in induced and non-induced FLQ10 and FLQ65 cells using an ATXN7 antibody (upper panel) and GFP fluorescence (lower panel). Arrows indicate inclusions. f Cytoplasmic (Cyt) and nuclear (N) proteins were separated by fractionation and the localization of ATXN7 analyzed by western blot. For quantifications, all data are shown as means ± SEM from three independent experiments. ***p < 0.001
Fig. 2
Fig. 2
Expansion of the polyglutamine domain stabilizes the ATXN7 protein. a Clearance of soluble full-length ATXN7, soluble ATXN7 fragments, and aggregated ATXN7 material. Doxycycline was added (turn off) to the media of FLQ10 or FLQ65 cells induced to express ATX7Q10-GFP or ATXN7Q65-GFP for 10 days and the ATXN7 clearance analyzed during 12 h. Upper panel: ATXN7 western blot analysis of ATXN7Q10-GFP cell extracts, middle panel: western blot for ATXN7Q65-GFP cells, and lower panel: filter trap analysis for ATXN7Q65-GFP cells. b Quantification of the clearance from three independent experiments. The ataxin-7 intensity was normalized with actin (loading control) and the average value of 0 h from three independent experiments was set to 100%. c Analysis of clearance of aggregated ATXN7Q65 material during 288 h using the filter trap assay. Upper panel: a representative blot, lower panel: quantification of clearance based on three independent experiments. All data are shown as means ± SEM. *p < 0.05
Fig. 3
Fig. 3
Endogenous ATXN7 and ATXN7Q10-GFP are mainly degraded by UPS in PC12 cells. Expression of ATXN7Q10-GFP was turned off (+Dox) in FLQ10 cells induced for 10 days and the level of endogenous and ATXN7Q10-GFP during 24 h was analyzed in the absence or presence of UPS inhibition, autophagy inhibition, or autophagy activation. a Representative western blot analysis of soluble full-length ATXN7Q10-GFP, endogenous ATXN7, and Q10 fragment after inhibition of UPS with 200 nM epoxomycin. Probing for poly-ubiquitinated proteins was done to verify UPS inhibition. b Representative western blot analysis of soluble full-length ATXN7Q10-GFP, endogenous ATXN7, and Q10 fragment after autophagy inhibition with 100 mM 3-MA or 10 mM NH4Cl, as well as autophagy activation with 200 nM rapamycin. Probing for LC3 II was done to verify the activation or inhibition of autophagy. c Quantification of ATXN7 levels from three independent western blots as shown in a and b. The ATXN7 intensity was normalized with actin (loading control) and the average value of the −Dox control from three independent experiments was set to 100%. Data are shown as means ± SEM. *p < 0.05; **p < 0.01; ***p < 0.001
Fig. 4
Fig. 4
Autophagy and UPS synergistically regulate transient transfected ATXN7Q10 degradation in HEK 293 T cells. The level of endogenous ATXN7 or ATXN7Q10-Myc in transfected HEK 293 T cells was analyzed after a 24- or 48-h incubation with UPS inhibition and/or autophagy inhibition or activation. Non-treated transfected cells were used as control. a Effect of UPS inhibition. Top panel: a representative western blot for full-length (FL) ATXN7Q10-Myc, endogenous ATXN7, and the 40-kDa Q10 fragment. Middle panel: UPS inhibition was confirmed by probing for poly-ubiquitinated proteins. Bottom panel: Quantification of ATXN7 after normalization with actin (loading control) from three independent experiments with non-treated control cells set to 100%. b Effect of autophagy inhibition with 3-MA. Top panel: a representative ATXN7 western blot. Middle panel: LC3 probing to verify the effect of 3-MA on autophagy. Bottom panel: quantification of ATXN7 after normalization with actin (loading control) from three independent experiments with non-treated control cells set to 100%. c The effects of combined inhibition of UPS and autophagy on full-length (FL) ATXN7Q10-Myc and the Q10 fragment. Representative western blot (top panel) and quantification from three independent experiments (bottom panel). For quantifications, ATXN7 was normalized with actin (loading control) and non-treated control cells set to 100%. d Effect of activation of autophagy with rapamycin or trehalose on endogenous ATXN7, full-length ATXN7Q10-GFP, and Q10 ATXN7 fragment. Top panels: representative western blots, bottom panels: quantifications from three independent experiments. For quantifications, ATXN7 was normalized with actin (loading control) and non-treated control cells set to 100%. LC3 probing was done to verify the effect of the treatment on autophagy (middle panels). For all graphs, data are shown as means ± SEM. *p < 0.05; **p < 0.01; ***p < 0.001
Fig. 5
Fig. 5
Clearance of soluble ATXN7Q65 by UPS but contribution by autophagy to the reduction of aggregated ATXN7Q65 material in PC12 cells. Expression of ATXN7Q65-GFP was turned off (+Dox) in FLQ65 cells induced for 10 days, and the clearance of ATXN7 during 24 h was analyzed in the absence or presence of UPS inhibition or autophagy inhibition or activation. a Analysis of soluble full-length ATXN7Q65-GFP and Q65 fragments 1 and 2. Top panel: a representative western blot, lower panel: quantification of three independent experiments. For quantifications, ATXN7 was normalized against actin (loading control). b Analysis of aggregated ATXN7 material using filter trap assay after UPS and autophagy inhibition or activation. Top panels: representative blot, lower panel: quantification of three independent experiments with the level in untreated + Dox sample set to 100%. Data are shown as means ± SEM. *p < 0.05; **p < 0.01; ***p < 0001
Fig. 6
Fig. 6
Both UPS and autophagy degrade mutant ATXN7 in HEK 293T cells. HEK 293T cells transfected to express ATXN7Q65-Myc was treated with UPS and or autophagy inhibitors or activators for 24 or 48 h and the level of aggregated ATXN7 material analyzed. Non-treated transfected cells were used as control. a Effect of UPS inhibition with epoxomycin, autophagy inhibition with 3-MA, and combined treatment with epoxomycin plus 3-MA. Top panel: representative blot, bottom panel: quantification. b Analysis of aggregated ATXN7 material after activation of autophagy by rapamycin (left side) or trehalose (right side). For all graphs, quantifications were done from three independent experiments and data are shown as means ± SEM. *p < 0.05; **p < 0.01; ***p < 0.001; ns not significant
Fig. 7
Fig. 7
Induction of ATXN7Q65-GFP in PC12 cells does not result in increased autophagic activity. FLQ65 cells were induced to express ATXN7Q65-GFP for the indicated number of days before the cells were harvested and the levels of LC3 I and II analyzed by western blot. Induction of ATXN7Q65-GFP was verified by ATXN7 probing and actin was used as loading control. Lower panel shows quantification of the LC3 II level normalized against actin from three independent experiments. Data are shown as means ± SEM
Fig. 8
Fig. 8
UPS and autophagy both contribute to the clearance of ATXN7 species in PC12 cells continuously expressing ATXN7Q65-GFP. The expression of ATXN7Q65-GFP was induced in FLQ65 PC12 cells for 8 days and the cells treated with UPS or autophagy inhibitors or activators for the last 24–48 h. Induced but non-treated cells were used as control. a Epoxomycin treatment for 24 h. Top panel: representative ATXN7 blot, middle panel: probing for poly-ubiquitinated proteins to verify UPS inhibition, and bottom panel: quantification of ATXN7. b Analysis of aggregated ATXN7 material after 24 h of UPS inhibition. Top panel: representative blot, bottom panel: quantification. c Inhibition of autophagy with 3-MA for 24 h or NH4Cl for 48 h, as well as activation of autophagy with rapamycin for 48 h. Top panel: representative ATXN7 western blots, middle panel: probings for LC3 to verify the effect of the treatment on autophagy, and bottom panel: quantification of ATXN7. d Analysis of aggregated ATXN7 material after the same treatments as in c. Top panel: representative ATXN7 blot, lower panel quantification. e The number of cells with ATXN7-positive inclusions after UPS and autophagy inhibition. Non-treated cells were used as control. All quantifications were done from three independent experiments, and for analysis of soluble ATXN7 levels, the ATXN7 intensity was normalized against actin (loading control). Data are shown as means ± SEM. *p < 0.05; **p < 0.01; ***p < 0.001
Fig. 9
Fig. 9
Pharmacological activation of autophagy ameliorates the ATXN7Q65 toxicity. The viability of non-induced or FLQ65 cells induced to express ATXN7Q65-GFP for 8 days while treated with inhibitors or activators for the last 24–48 h as indicated in the figure was analyzed. As controls, non-induced or induced non-treated cells were used. The cell viability was analyzed using the WST-1 assay and normalized against the protein concentration. a The induction of ATXN7Q65-GFP expression caused an approximately 20% decrease in cell viability compared to the non-induced control. Treatment of ATXN7Q65-GFP expressing cells with the UPS inhibitor epoxomycin or the autophagy inhibitors 3-MA and NH4Cl leads to a further circa 30.1%, 37.0%, and 25.0% decrease in cell viability. Decreases in cell viability were also seen after treatment of non-induced FLQ65 cells; however, the effect of inhibitors was statistically greater in ATXN7Q65-GFP expressing cells. b Treatment of ATXN7Q65-GFP expressing cells with the autophagy activator rapamycin for 24 or 48 h restored viability of the ATXN7Q65-GFP cells to the same level as in non-expressing ATXN7Q65-GFP cells. All quantifications were done with data from three independent experiments and data are shown as means ± SEM. *p < 0.05; ***p < 0.001

Similar articles

Cited by

References

    1. Abeliovich H, Dunn WA, Jr, Kim J, Klionsky DJ. Dissection of autophagosome biogenesis into distinct nucleation and expansion steps. J Cell Biol. 2000;151:1025–1034. doi: 10.1083/jcb.151.5.1025. - DOI - PMC - PubMed
    1. Bence NF, Sampat RM, Kopito RR. Impairment of the ubiquitin–proteasome system by protein aggregation. Science. 2001;292:1552–1555. doi: 10.1126/science.292.5521.1552. - DOI - PubMed
    1. Bennett EJ, Shaler TA, Woodman B, Ryu KY, Zaitseva TS, Becker CH, Bates GP, Schulman H, Kopito RR. Global changes to the ubiquitin system in Huntington’s disease. Nature. 2007;448:704–708. doi: 10.1038/nature06022. - DOI - PubMed
    1. Blommaart EF, Luiken JJ, Blommaart PJ, van Woerkom GM, Meijer AJ. Phosphorylation of ribosomal protein S6 is inhibitory for autophagy in isolated rat hepatocytes. J Biol Chem. 1995;270:2320–2326. doi: 10.1074/jbc.270.5.2320. - DOI - PubMed
    1. Cuervo AM, Stefanis L, Fredenburg R, Lansbury PT, Sulzer D. Impaired degradation of mutant alpha-synuclein by chaperone-mediated autophagy. Science. 2004;305:1292–1295. doi: 10.1126/science.1101738. - DOI - PubMed

Publication types

LinkOut - more resources