

Repression of miR-142 by p300 and MAPK is required for survival signalling via gp130 during adaptive hypertrophy
- PMID: 22367739
- PMCID: PMC3407949
- DOI: 10.1002/emmm.201200234
Repression of miR-142 by p300 and MAPK is required for survival signalling via gp130 during adaptive hypertrophy
Abstract
An increase in cardiac workload, ultimately resulting in hypertrophy, generates oxidative stress and therefore requires the activation of both survival and growth signal pathways. Here, we wanted to characterize the regulators, targets and mechanistic roles of miR-142, a microRNA (miRNA) negatively regulated during hypertrophy. We show that both miRNA-142-3p and -5p are repressed by serum-derived growth factors in cultured cardiac myocytes, in models of cardiac hypertrophy in vivo and in human cardiomyopathic hearts. Levels of miR-142 are inversely related to levels of acetyltransferase p300 and MAPK activity. When present, miR-142 inhibits both survival and growth pathways by directly targeting nodal regulators p300 and gp130. MiR-142 also potently represses multiple components of the NF-κB pathway, preventing cytokine-mediated NO production and blocks translation of α-actinin. Forced expression of miR-142 during hypertrophic growth induced extensive apoptosis and cardiac dysfunction; conversely, loss of miR-142 fully rescued cardiac function in a murine heart failure model. Downregulation of miR-142 is required to enable cytokine-mediated survival signalling during cardiac growth in response to haemodynamic stress and is a critical element of adaptive hypertrophy.
Copyright © 2012 EMBO Molecular Medicine.
Figures
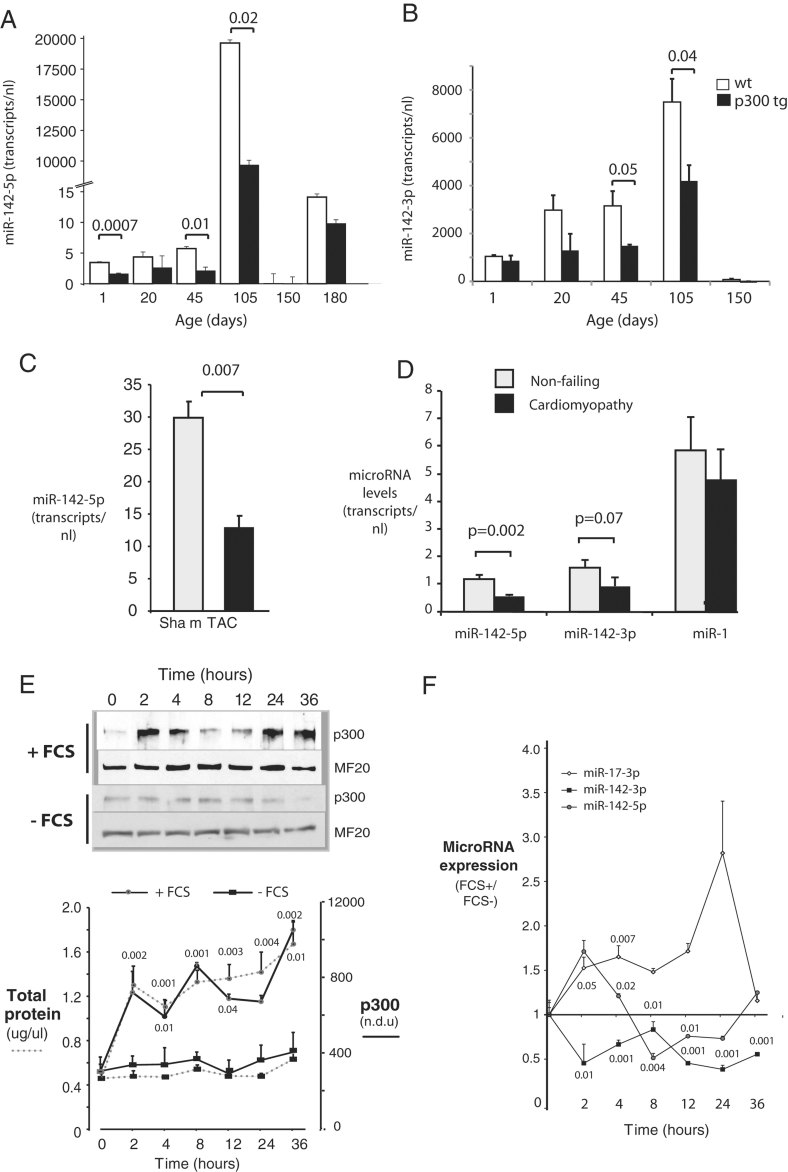
A,B. Repression of miR-142-5p and -3p during early postnatal cardiac growth. Hearts of wt and p300tg mouse littermates were harvested from mice at the indicated ages and miR-142-5p and -3p were quantitated in LV myocardium as described in Methods Section. n = 3 per group. p-Values comparing wt and p300tg hearts are shown where significant. (A) MiR-142-5p. (B) MiR-142-3p.
C. Repression of miR-142-5p during pressure-overload hypertrophy. Transverse aortic coarctation (TAC) or a sham procedure was performed as descried in Methods Section and miR-142-5p was assayed in LV 3 days later. n = 3 per group.
D. Repression of miR-142 in failing human heart. MicroRNAs were assayed in LV free wall from cardiomyopathic and non-failing hearts. n = 6 per group. For (A–D), microRNAs are expressed as transcripts per 10 ng total RNA.
E-F. Repression of miR-142 during cardiac myocyte hypertrophy in culture. NRVM in serum-free culture were placed in fresh media with or without 5% FCS and assayed between 0 and 36 h. Myocyte protein content and p300 levels increase in response to FCS. (Above) Representative immunoblots for p300 and myosin heavy chain (MF20). (Below) Quantitation of myocyte total protein (dotted lines) and p300 content (solid lines) at indicated time points. + FCS, closed red circles; − FCS, closed black rectangles (E). Repression of miR-142 by serum stimulation. MicroRNAs 142-3p and -5p were quantitated by RT-PCR in the same cells as in E. MicroRNA expression levels are normalized to basal levels in unstimulated cells at time 0 (F). For (E–F), n = 3, and p-values are given for comparison between serum-stimulated and non-stimulated cells at the same time point.
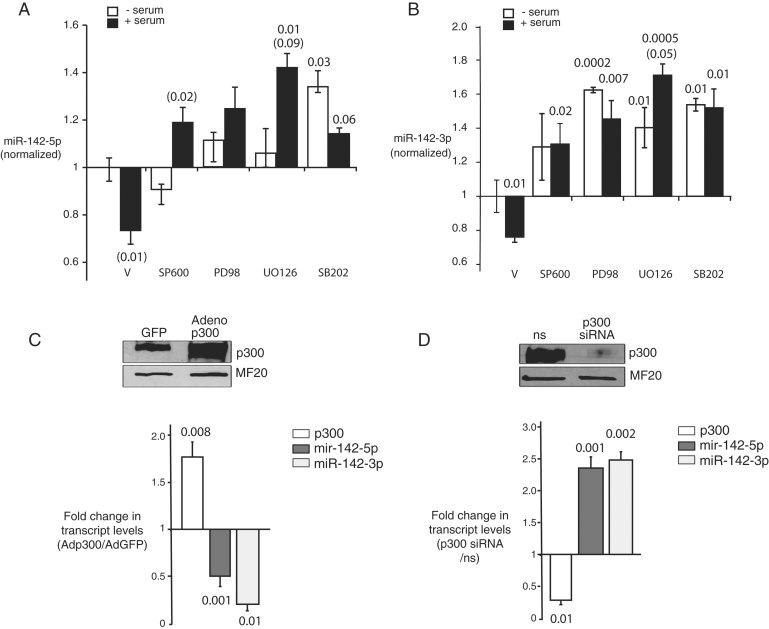
A,B. Repression of miR-142-5p and -3p by serum is reversed by MAPK inhibition. NRVM hypertrophy was induced as in 1D in the presence of MAP kinase inhibitors, or their vehicle (DMSO, V), and miR-142 levels were quantitated at 4 h. SB600 = SB600125 (JNK); PD98 = PD98059 (p42/44 MAPK); UO126 (MEKK1); SB202 = SB202190 (p38MAPK). All values are normalized to basal levels in serum-starved, vehicle-treated cells (V); p-values relative to V are supplied over each column where significant (p-Values in parentheses compare serum-treated to serum-starved cells in each inhibitor treatment group). (A) MiR-142-5p. (B) MiR-142-3p.
C. p300 represses expression of miR-142(-5p and -3p). NRVM were infected with adenoviral vectors expressing p300 (Ad-p300) or green fluorescent protein (Ad-GFP) and p300, miR-142-5p and -3p were quantitated at 48 h. Values are expressed as the ratio of expression in Ad-p300- versus Ad-GFP-transfected cells. A representative p300 immunoblot is shown.
D. Loss of p300 is sufficient to induce miR-142-5p and miR-142-3p. NRVM were transfected with anti-p300 siRNA or a ns and p300, miR-142-5p and miR-142-3p were quantitated at 48 h. Values are expressed as the ratio of expression in p300-targeting versus non-targeting siRNA-treated cells. n = at least 3 for all data points, A–D.
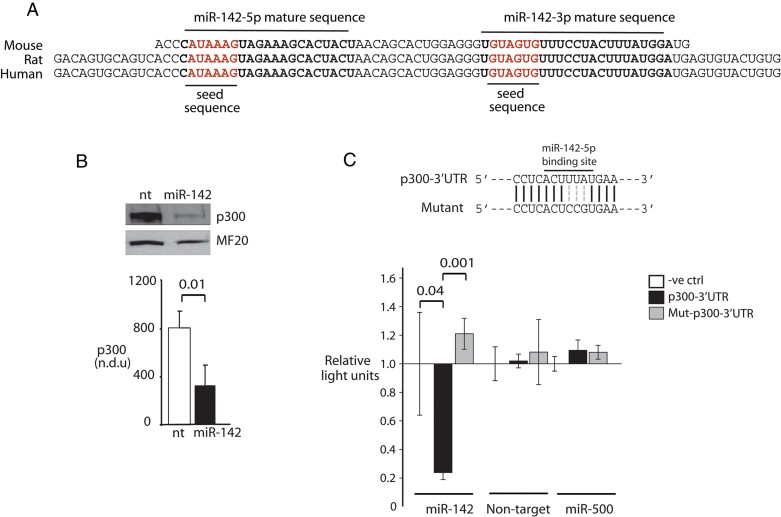
Conserved p300 3′UTR binding site for miR-142-5p.
MiR-142 over-expression (OE) represses p300. NRVM were infected with lentivirus encoding the miR-142 hairpin or a NT(see text). p300 levels were quantitated by immunoblot. NDU = normalized densitometry units. n = 3.
p300 repression is mediated by the 3′UTR miR-142-5p binding site. (Above) MiR-142 binding site and mutated sequence. (Below) Luciferase activity is sensitive to miR-142 binding. Luciferase constructs containing wt or mutant p300 3′UTR sequences were assayed in Cos7 cells stably expressing either RFP alone, miR-142-RFP, or an unrelated microRNA, miR-500-RFP. n = 3.
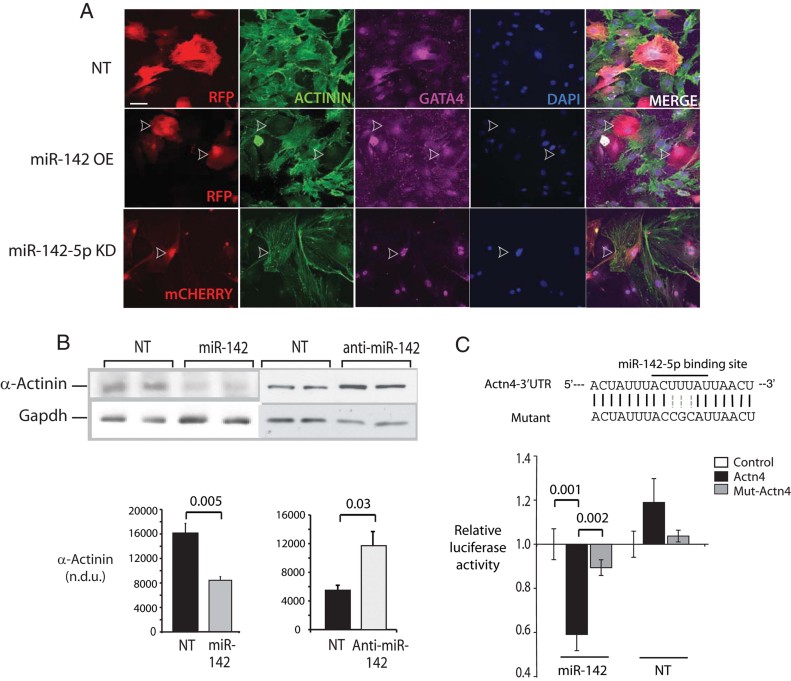
Regulation of α-actinin by miR-142. NRVM were transduced with viral vectors to achieve miR-142 OE or with antisense oligonucleotide targeting miR-142-5p (KD) then fixed and imaged by immunofluorescence 48 h later. Non-targeting sequence, NT sequence. Shown are stains using DAPI (blue) and antibodies directed against GATA4 (purple) and pan-α-Actinin (green). Transduced cells in each field are red due to RFP (top and centre) or mCherry (bottom) fluorescence.
Regulation of α-Actinin protein content by miR-142. NRVM were transduced with lentiviruses encoding the miR-142 hairpin, an antisense sequence against miR-142, or scrambled sequence controls (NT), for 48 h. Total cell lysates were analysed for α-Actinin expression by immunoblot. n = 3.
Targeting of the Actn4 3′UTR by miR-142-5p. (Above) A predicted miR-142-5p binding site in the Actn4 3′UTR was mutated. (Below) Luciferase constructs containing either the wt (Actn4) or mutant (mut-Actn4) binding sites, or an unrelated sequence (control) were expressed in Cos7 cells expressing miR-142-5p or a scrambled sequence. Luciferase activity was quantitated at 48 h and expressed relative to activity in the control vector in each of three experiments.
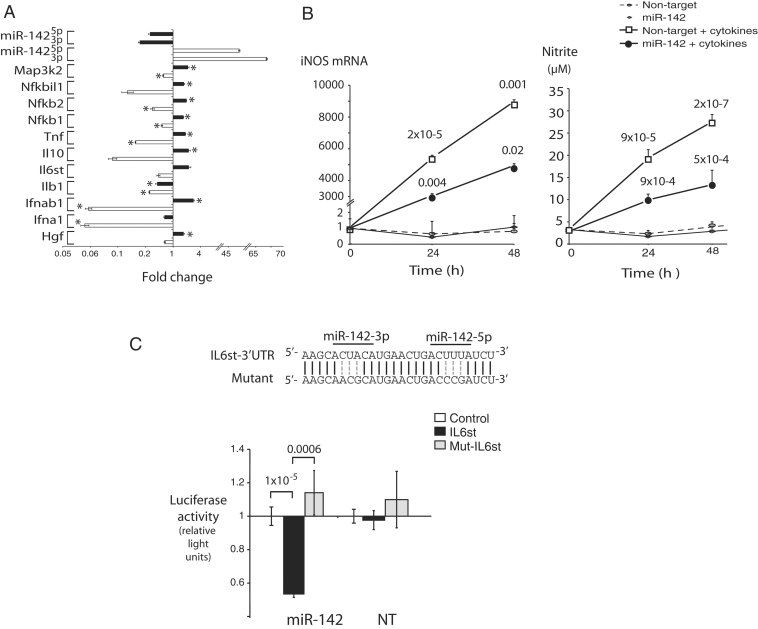
Cytokine signalling transcripts regulated during miR-142 gain and loss. Relative expression levels of the indicated genes were determined in NRVM following miR-142 OE and knockdown exactly as described in Fig 3A. n = 3, *p < 0.05. Actual p-values along with a complete list of differentially expressed cytokine pathway genes are provided in Table I of Supporting Information.
MiR-142 blocks cytokine-mediated induction of iNOS. NRVM infected with miR-142- or NT-lentivirus were treated with a mixture of IL1β, TNFα and IFNγ or their vehicle as described in Methods Section and assayed at the indicated time points. (Left) iNOS mRNA was quantitated by qPCR. (Right) Nitrite levels were measured in cell media as a readout of nitric oxide production. n = 8–12 determinations per condition; p-values on top curve compare NT cells with and without cytokines; p-values on miR-142 + cytokines curve are relative to NT cells + cytokines at the same time points.
gp130 (IL6st) is a direct target of miR-142-5p and 3p. (Above) The gp130 3′UTR paired binding sites for miR-142-5p and miR-142-3p, and a mutant sequence destroying both. (Below) Luciferase vectors incorporating the wt, mutant or a control unrelated 3′UTR sequence were tested for repression by miR-142 in Cos7 cells stably overexpressing miR-142 or a NT sequence.
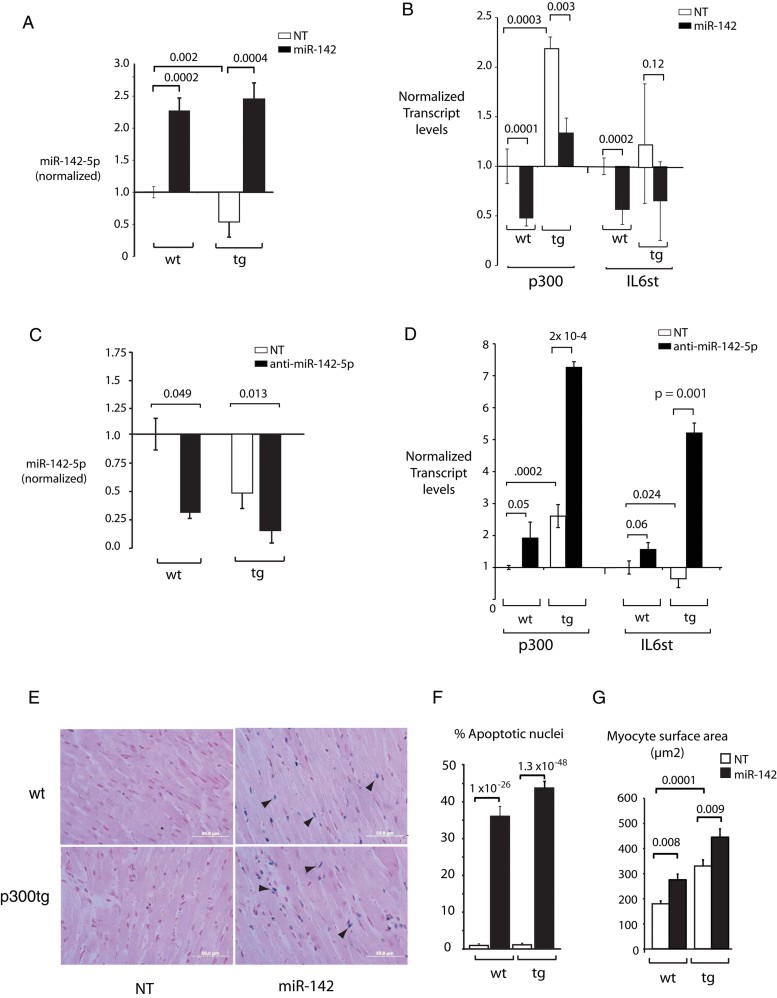
Sustained in vivo transduction of miR-142-5p. Neonatal wt and p300 transgenic littermates (tg) hearts were analysed for miR-142-5p expression at 2 months after transduction with lenti-miR-142 or –NT vectors.
Repression of p300 and gp130 by miR-142-5p in vivo. Transcripts were quantitated by qPCR as in (A); primers for p300 recognize both endogenous murine and human transgene-derived transcripts. Additional genes and gp130 and p300 protein levels are shown in Figs 5 and 6 of Supporting Information.
Sustained in vivo silencing of miR-142-5p by transduction of antimiR-142-5p. Neonatal mice hearts transduced with lentivirus expressing anti-miR-142-5p sequences or a scrambled control were analysed for miR-142-5p expression at 2 months.
Increased expression of p300 and gp130 following miR-142-5p silencing in vivo. Transcripts were quantitated in the same hearts measured in C.
MiR-142 induces growth-associated apoptosis. Representative LV myocardium images are shown. Apoptotic cells are stained blue (arrowheads). Original magnification: ×60.
Quantitation of apoptotic cells. n = 10 randomly chosen fields per section in each of five hearts per condition.
Myocyte enlargement. Cross-sectional surface pixels were measured in 25–30 cells per section in five hearts per condition using Lasso and Histogram tools in Adobe Photoshop and converted to square µM. Note that p300tg myocytes are significantly larger than wt myocytes in both treatment groups.
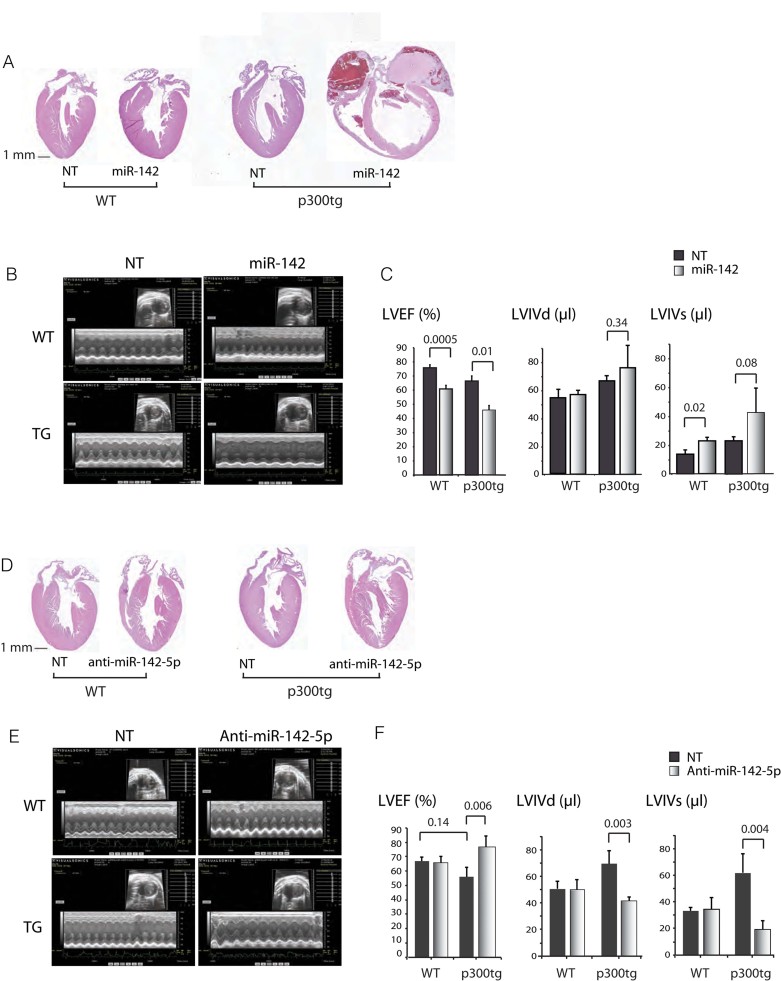
A-C. Restoration of miR-142 impairs cardiac function during postnatal growth.
A. Representative 4 chamber sections of wt and p300tg hearts treated with miR-142 or NT vectors. Haematoxylin and eosin staining of LV tissue from 2.5-month-old mice. Original magnification: 1×.
B. Representative echocardiographic images showing M-mode and 2D sectors for each genotype and condition.
C. LV systolic function. Left ventricular ejection fraction (LVEF) and internal dimensions in systole and diastole (LVIDs and LVIDd) are shown. n = 5–8 per group. See also Table III of Supporting Information.
D-F. Inhibition of miR-142-5p/-3p rescues systolic function in p300tg mice.
D. Representative four chamber sections of wt and p300tg hearts treated with anti-miR-142 or NT vectors, as in 6A.
E. Representative 2D and M-mode images.
F. Quantitation of LVEF, LVIDs and LVIDd. n = 3–6 animals per group. See Table IV of Supporting Information for summary of all parameters.
Similar articles
-
MiR-378 controls cardiac hypertrophy by combined repression of mitogen-activated protein kinase pathway factors.Circulation. 2013 May 28;127(21):2097-106. doi: 10.1161/CIRCULATIONAHA.112.000882. Epub 2013 Apr 26. Circulation. 2013. PMID: 23625957
-
MicroRNA-223 displays a protective role against cardiomyocyte hypertrophy by targeting cardiac troponin I-interacting kinase.Cell Physiol Biochem. 2015;35(4):1546-56. doi: 10.1159/000373970. Epub 2015 Mar 12. Cell Physiol Biochem. 2015. PMID: 25792377
-
Qiliqiangxin Attenuates Phenylephrine-Induced Cardiac Hypertrophy through Downregulation of MiR-199a-5p.Cell Physiol Biochem. 2016;38(5):1743-51. doi: 10.1159/000443113. Epub 2016 May 9. Cell Physiol Biochem. 2016. PMID: 27161004
-
Survival pathways in hypertrophy and heart failure: the gp130-STAT3 axis.Basic Res Cardiol. 2007 Jul;102(4):279-97. doi: 10.1007/s00395-007-0658-z. Epub 2007 May 29. Basic Res Cardiol. 2007. Corrected and republished in: Basic Res Cardiol. 2007 Sep;102(5):393-411. doi: 10.1007/s00395-007-0674-z. PMID: 17530315 Corrected and republished. Review.
-
Molecular basis of physiological heart growth: fundamental concepts and new players.Nat Rev Mol Cell Biol. 2013 Jan;14(1):38-48. doi: 10.1038/nrm3495. Nat Rev Mol Cell Biol. 2013. PMID: 23258295 Free PMC article. Review.
Cited by
-
miR-142: A Master Regulator in Hematological Malignancies and Therapeutic Opportunities.Cells. 2023 Dec 30;13(1):84. doi: 10.3390/cells13010084. Cells. 2023. PMID: 38201290 Free PMC article. Review.
-
miR-142 controls metabolic reprogramming that regulates dendritic cell activation.J Clin Invest. 2019 Apr 8;129(5):2029-2042. doi: 10.1172/JCI123839. eCollection 2019 Apr 8. J Clin Invest. 2019. PMID: 30958798 Free PMC article.
-
Plasma miR-142 predicts major adverse cardiovascular events as an intermediate biomarker of dual antiplatelet therapy.Acta Pharmacol Sin. 2019 Feb;40(2):208-215. doi: 10.1038/s41401-018-0041-7. Epub 2018 Jun 11. Acta Pharmacol Sin. 2019. PMID: 29891858 Free PMC article.
-
Acute stressor exposure modifies plasma exosome-associated heat shock protein 72 (Hsp72) and microRNA (miR-142-5p and miR-203).PLoS One. 2014 Sep 26;9(9):e108748. doi: 10.1371/journal.pone.0108748. eCollection 2014. PLoS One. 2014. PMID: 25259839 Free PMC article.
-
Downregulation of miR-142a Contributes to the Enhanced Anti-Apoptotic Ability of Murine Chronic Myelogenous Leukemia Cells.Front Oncol. 2021 Jul 27;11:718731. doi: 10.3389/fonc.2021.718731. eCollection 2021. Front Oncol. 2021. PMID: 34386429 Free PMC article.
References
-
- Andreka P, Dougherty C, Slepak TI, Webster KA, Bishopric NH. Cytoprotection by Jun kinase during nitric oxide-induced cardiac myocyte apoptosis. Circ Res. 2001;88:305–312. - PubMed
-
- Bagga S, Bracht J, Hunter S, Massirer K, Holtz J, Eachus R, Pasquinelli AE. Regulation by let-7 and lin-4 miRNAs results in target mRNA degradation. Cell. 2005;122:553–563. - PubMed
Publication types
MeSH terms
Substances
Grants and funding
LinkOut - more resources
Full Text Sources
Other Literature Sources
Molecular Biology Databases
Miscellaneous
