. 2013 Feb;23(2):460-76.
doi: 10.1093/cercor/bhs038. Epub 2012 Feb 23.

Borders and comparative cytoarchitecture of the perirhinal and postrhinal cortices in an F1 hybrid mouse

Affiliations

Borders and comparative cytoarchitecture of the perirhinal and postrhinal cortices in an F1 hybrid mouse

Stephane A Beaudin et al. Cereb Cortex. 2013 Feb.

Abstract

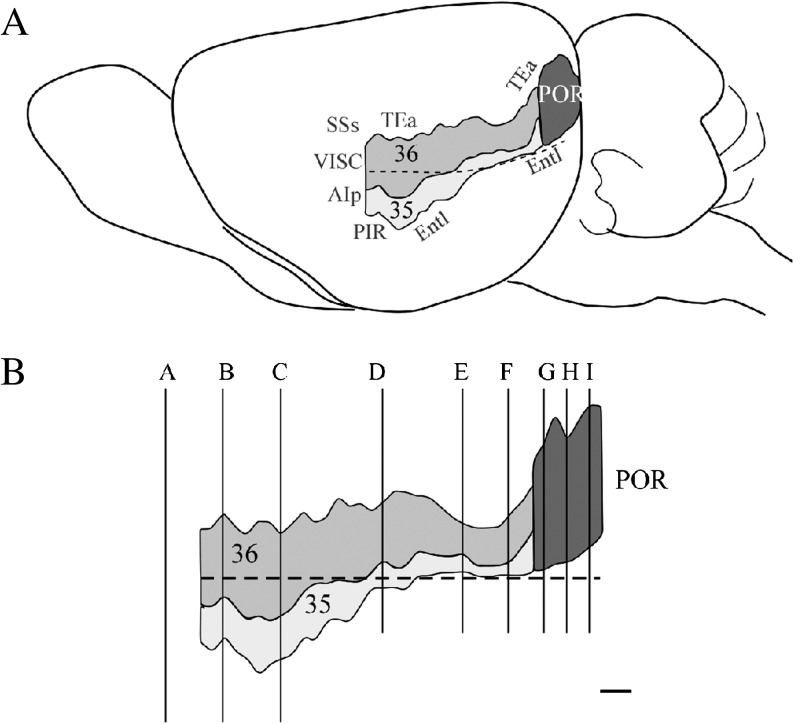
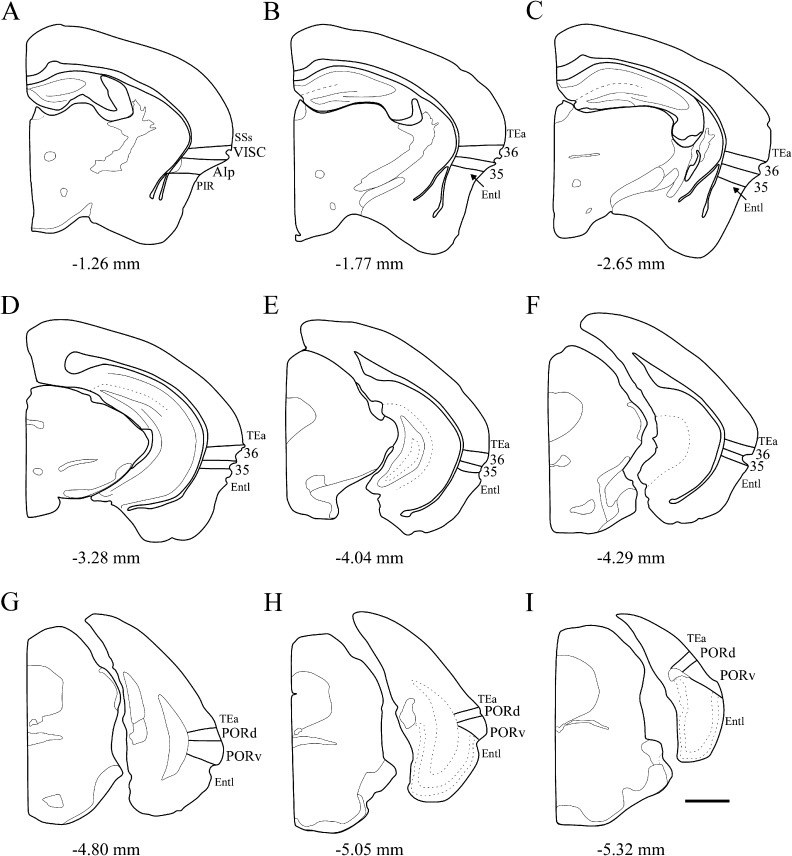
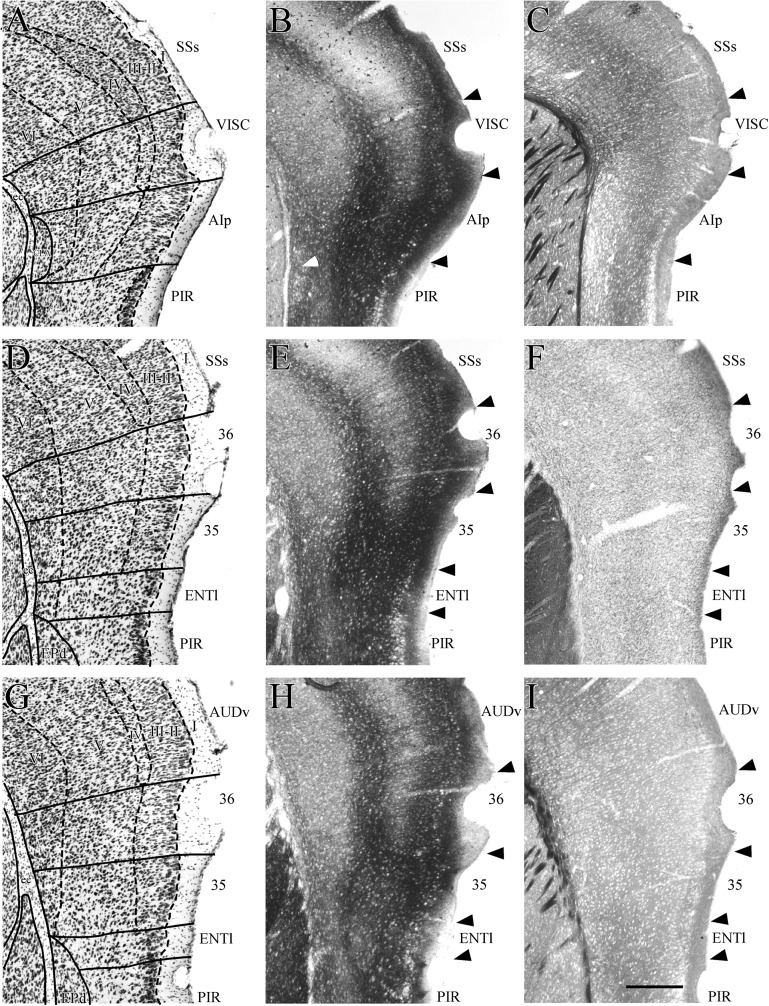
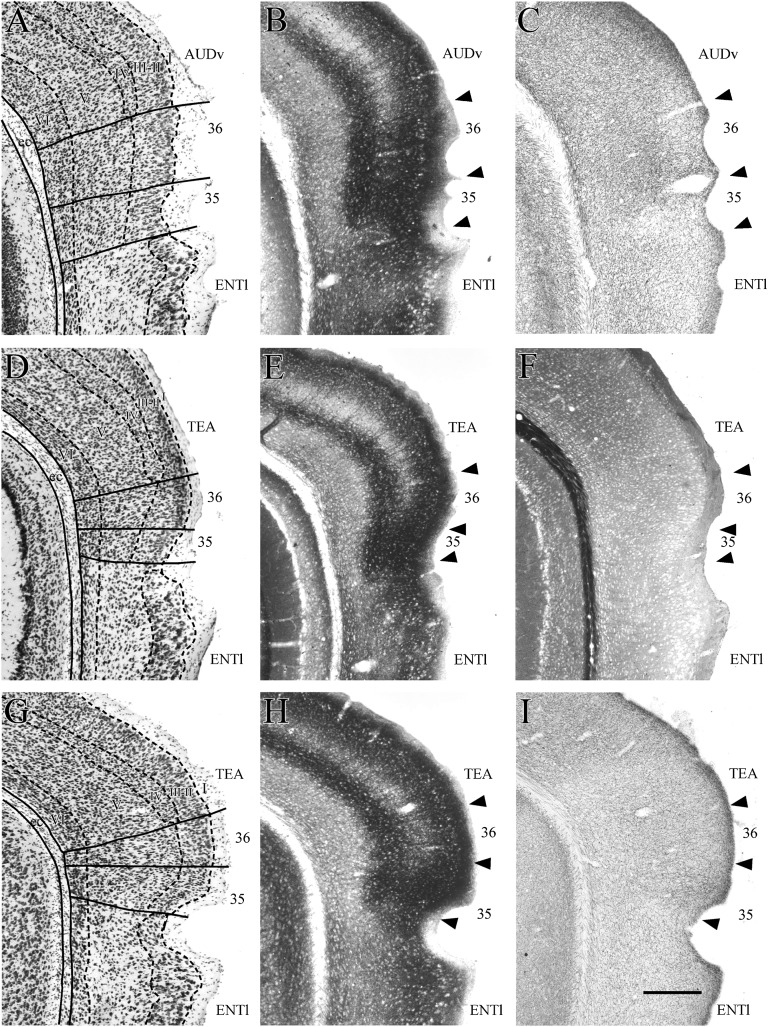
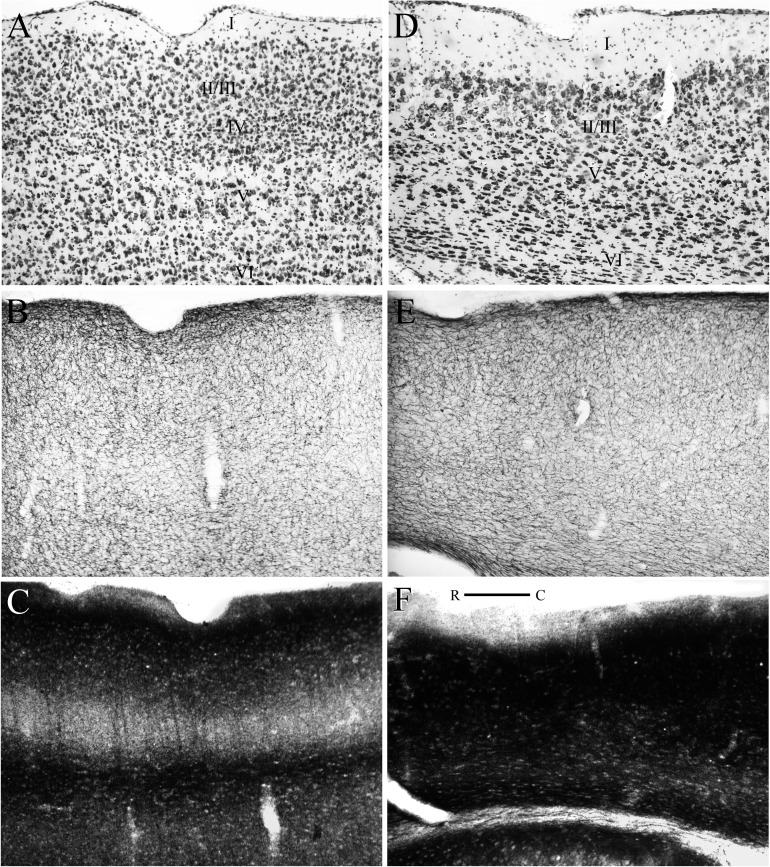
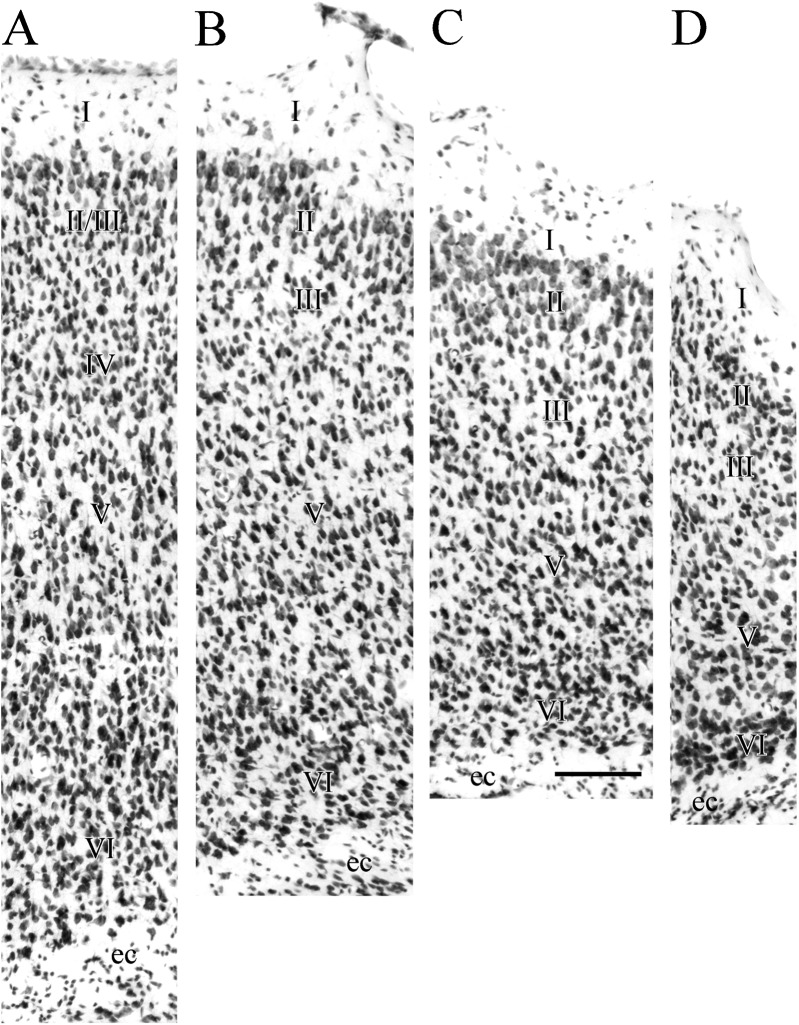
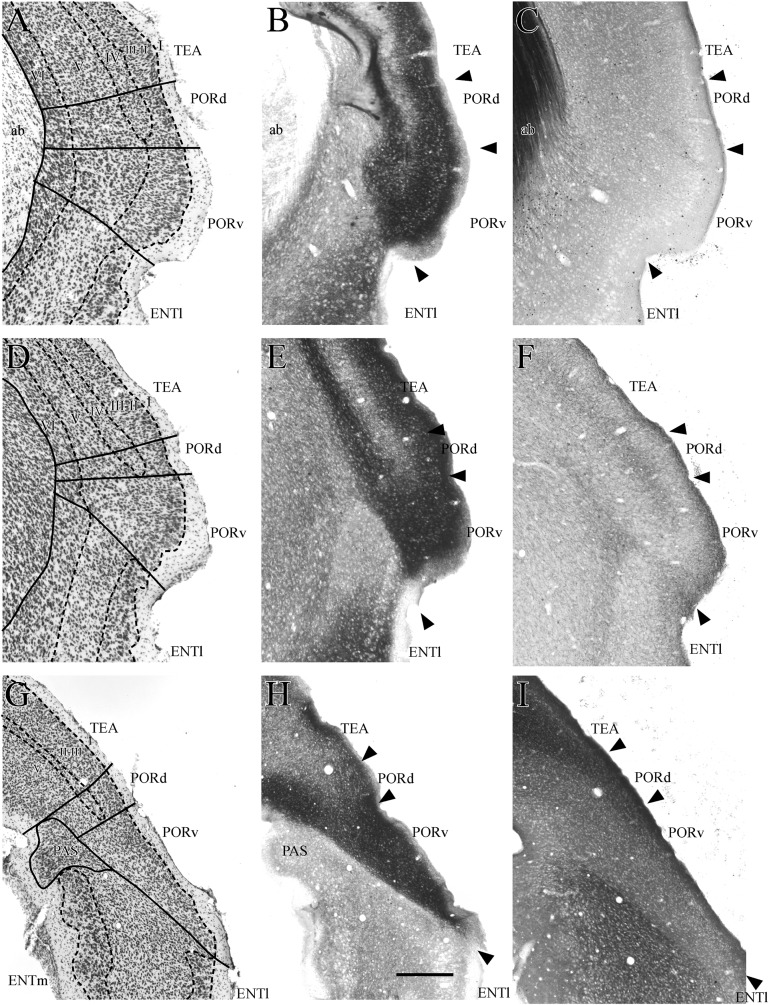
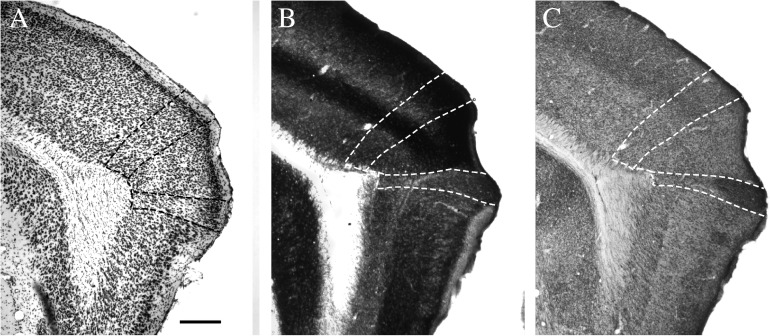
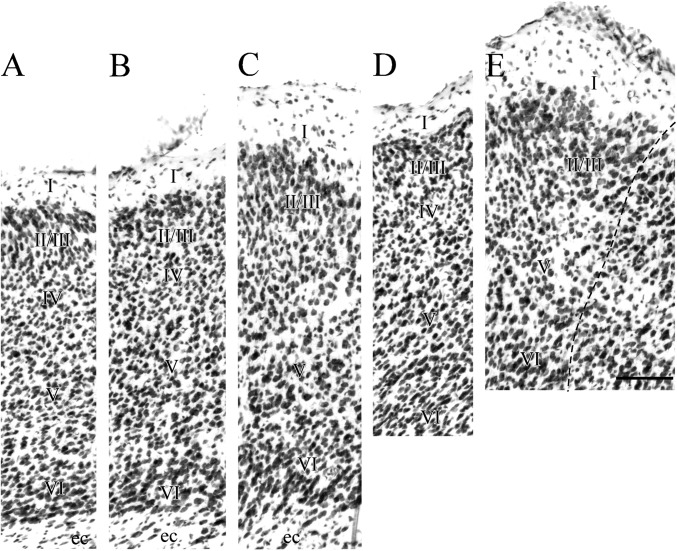
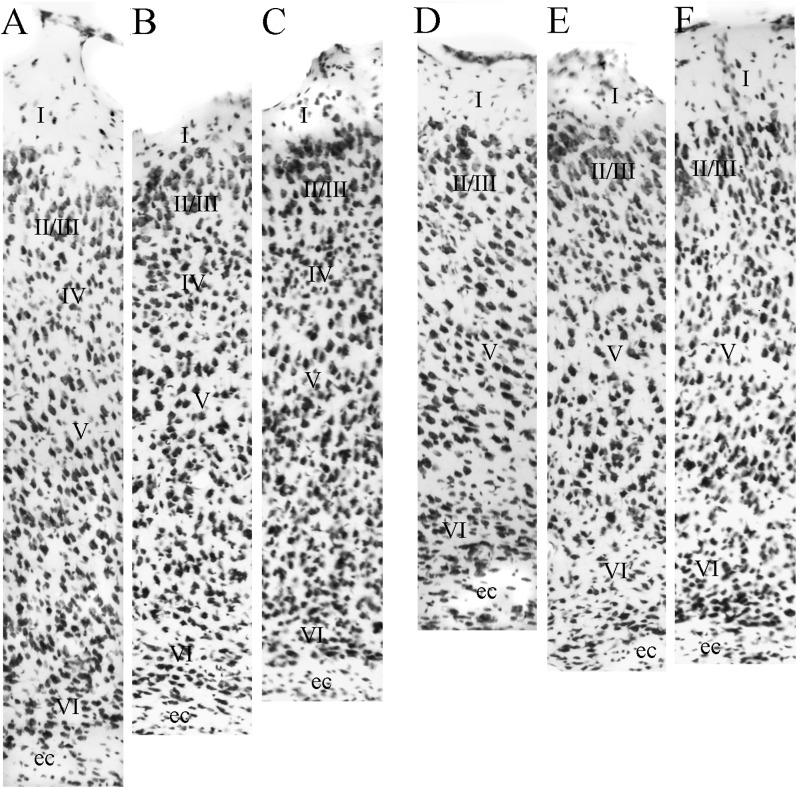
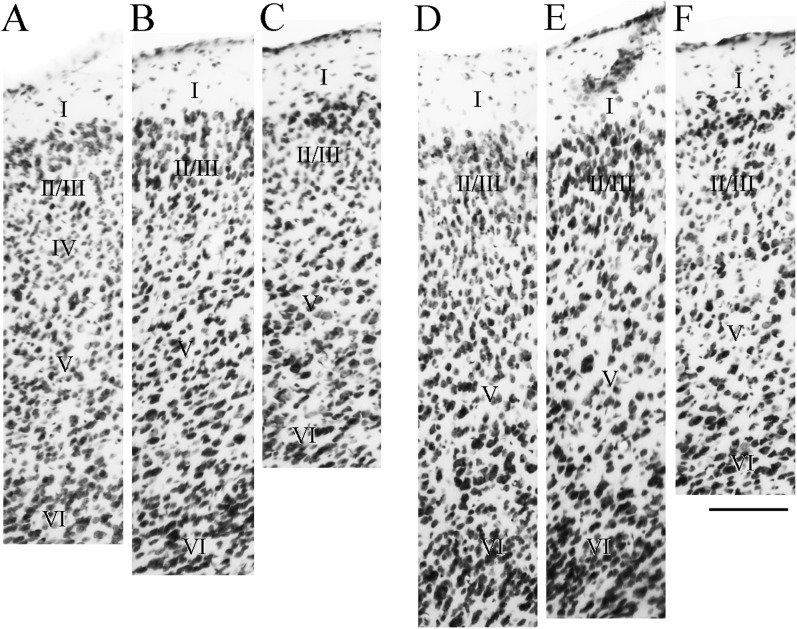
We examined the cytoarchitectonic and chemoarchitectonic organization of the cortical regions associated with the posterior rhinal fissure in the mouse brain, within the framework of what is known about these regions in the rat. Primary observations were in a first-generation hybrid mouse line, B6129PF/J1. The F1 hybrid was chosen because of the many advantages afforded in the study of the molecular and cellular bases of learning and memory. Comparisons with the parent strains, the C57BL6/J and 129P3/J are also reported. Mouse brain tissue was processed for visualization of Nissl material, myelin, acetyl cholinesterase, parvalbumin, and heavy metals. Tissue stained for heavy metals by the Timm's method was particularly useful in the assignment of borders and in the comparative analyses because the patterns of staining were similar across species and strains. As in the rat, the areas examined were parcellated into 2 regions, the perirhinal and the postrhinal cortices. The perirhinal cortex was divided into areas 35 and 36, and the postrhinal cortex was divided into dorsal (PORd) and ventral (PORv) subregions. In addition to identifying the borders of the perirhinal cortex, we were able to identify a region in the mouse brain that shares signature features with the rat postrhinal cortex.


Figures

Figure 1.
Figure 1.
Historical views of the mouse cortical mantle. (A) Lateral surface view of the mouse brain adapted from Rose (1929). Ectorhinal cortex is shown in dark gray and perirhinal cortex is shown in light gray. (B) Dorsolateral surface view adapted from Caviness (1975). Area 36 is shown in dark gray and area 35 is shown in light gray. Note that the perspectives differ in these 2 views. Both views describe the rostral limit of the perirhinal areas as arising at the caudal limit of the claustrum. The dorsal border is more dorsal in Rose (1929), though this is overemphasized, here, because of differences in perspective. See text for details about nomenclature.
Figure 2.
Figure 2.
Perirhinal (PER) and postrhinal (POR) cortices of the mouse. (A) Lateral surface view of the mouse brain illustrating the borders. (B) Unfolded map of the perirhinal and postrhinal cortices of a representative case. In both A and B, the dashed line indicates the rhinal fissure. Coronal levels illustrated in Figures 3, 4, 7, and 10 are indicated by vertical lines. Letters associated with each level correspond to the panels in Figure 3. Scale bar (panel B) = 250 μm. Other abbreviations: 36, area 36; 35, area 35; AIp, posterior insular cortex; Entl, lateral entorhinal area; PIR, piriform cortex; PORd, dorsal POR; PORv, ventral POR; TEa, temporal association areas; VISC, visceral area.
Figure 3.
Figure 3.
Schematic of the mouse brain showing 9 rostrocaudal levels in the coronal plane. Levels on the top row, middle, and bottom rows are those shown in Figures 4, 5, and 10, respectively. Rostral to caudal levels are identified relative to bregma coordinates for a representative male first-generation hybrid, B6129PF/J1, weighing approximately 30 g at about 12 weeks of age. Scale bar = 1000 μm. Abbreviations: 36, area 36; 35, area 35; AIp, posterior insular cortex; Entl, lateral entorhinal area; PIR, piriform cortex; PORd, dorsal POR; PORv, ventral POR; TEa, temporal association areas; VISC, visceral area.
Figure 4.
Figure 4.
Coronal sections showing rostral perirhinal cortex (PER) and bordering regions. Shown are the rostrally adjacent insular region (VISC) at one level (top row) and the perirhinal areas 35 and 36 at 2 rostrocaudal levels (middle and bottom rows). At each level, adjacent sections were stained for Nissl material (A,D, and G), heavy metals using Timm’s method (B, E, and H), myelinated fibers (C and I), and the enzyme acetycholinesterase (F). The claustrum, located deep to insular cortex, is easy to identify in Nissl and Timm’s material. It is outlined in panel A and designated by the white arrow in panel B. Other abbreviations: AIp, posterior agranular insular; AUDv, ventral auditory cortex; ec, external capsule; ENTl, lateral entorhinal area; EPd, the dorsal part of endopiriform nucleus; PIR, piriform cortex; SSs, secondary somatosensory.
Figure 5.
Figure 5.
Coronal sections showing caudal perirhinal (PER) areas 35 and 36 and adjacent cortical regions at 3 rostrocaudal levels. Adjacent sections stained for Nissl material (A, D, and G), heavy metals using Timm’s method (B, E, and G), myelinated fibers (F), and the enzyme acetycholinesterase (C and I). Other abbreviations: AUDv, ventral auditory cortex; ENTl, lateral entorhinal area; PIR, piriform cortex; SSs, secondary somatosensory; TEA, temporal association area.
Figure 6.
Figure 6.
Horizontal sections showing the cytoarchitecture and histochemistry of perirhinal areas 36 (left panels) and 35 (right panels). Adjacent sections were stained for Nissl material (A and D), the enzyme acetycholinesterase (B and E), and heavy metals using the Timm’s method (C and F). Note the vestigial granular layer in area 36, panel A. Abbreviations: R, rostral; C, caudal. Scale bar = 200 μm.
Figure 7.
Figure 7.
Photomicrographs showing the cortical layers of the insular cortex at –1.20 mm relative to bregma. Sections were stained for Nissl material. VISC has a discrete layer IV (A), whereas layer IV of AIp is better described as dysgranular (B). Layer V of both VISC and AIp exhibits cells of similar size, staining characteristics, and packing density. Abbreviations: cl, claustrum; ec, external capsule. Scale bar = 100 μm.
Figure 8.
Figure 8.
Photomicrographs showing the cortical layers of area SSs (A), and area 36 (B,D) at 3 rostrocaudal levels: –1.77, –2.65, and –4.04 mm relative to Bregma. Sections were stained for Nissl material. Abbreviation: ec, external capsule. Scale bar = 100 μm.
Figure 9.
Figure 9.
Photomicrographs showing the cortical layers of area 35 at 3 rostrocaudal levels (AC) corresponding to −1.77, −2.65, and −4.04 mm relative to Bregma. Sections were stained for Nissl material. Abbreviation: ec, external capsule. Scale bar = 100 μm.
Figure 10.
Figure 10.
Coronal sections showing the dorsal (PORd) and ventral (PORv) postrhinal cortex and adjacent cortical areas at 3 rostrocaudal levels. Adjacent sections were stained for Nissl material (A, D, and G), heavy metals using Timm’s method (B, E, and H), myelinated fibers (C and I), and the enzyme acetycholinesterase (F). Other abbreviations: ab, angular bundle; ENTl, lateral entorhinal area; ENTm, medial entorhinal area; TEA, temporal association area.
Figure 11.
Figure 11.
Sagittal sections showing the dorsal (PORd) and ventral (PORv) postrhinal cortex and adjacent cortical areas. Adjacent sections were stained for Nissl material (A), the enzyme acetycholinesterase (B), and heavy metals using Timm’s method (C). Scale bar = 200 μm.
Figure 12.
Figure 12.
Photomicrographs of the cortical layers of areas TEA (A), PORd (B), and PORv (C) at −4.80 mm relative to Bregma, and PORd (D) and PORv (E) at −5.05 mm relative to Bregma. Sections were stained for Nissl material. Scale bar = 100 μm.
Figure 13.
Figure 13.
Photomicrographs comparing cortical layers of PER areas area 36 and 35 across strains. Shown are cortical layers for area 36 (AC) and area 35 (DF) for the F1 (A and D), the C57BL6/J, (B and E), and 129P3/J (C and F) mouse strains. The tissue was stained for Nissl material. Scale bar = 100 μm.
Figure 14.
Figure 14.
Photomicrographs comparing cortical layers of areas area 36 and POR across strains. Shown are cortical layers PORd (AC) and PORv (DF) for the F1 (A and D), the C57BL6/J, (B and E), and 129P3/J (C and F) mouse strains. Note that for PORd, only F1 has a clear, though dysgranular, layer IV. Scale bar = 100 μm.

References

    1. Aggleton JP, Brown MW. Contrasting hippocampal and perirhinal cortex function using immediate early gene imaging. Q J Exp Psychol B. 2005;58:218–233. - PubMed
    1. Amaral DG, Insausti R, Cowan WM. The entorhinal cortex of the monkey: I. Cytoarchitectonic organization. J CompNeurol. 1987;264:326–355. - PubMed
    1. Brodmann K. Vergleichende Lokalisationslehre der Grosshirnrinde in ihren Prinzipien dargestellt auf Grund des Zellenbaues. Leipzig (Germany): Barth; 1909.
    1. Bucci DJ, Burwell RD. Deficits in attentional orienting following damage to the perirhinal or postrhinal cortices. Behav Neurosci. 2004;118:1117–1122. - PubMed
    1. Buckley MJ, Gaffan D. Perirhinal cortical contributions to object perception. Trends Cogn Sci. 2006;10:100–107. - PubMed

Publication types