Label-free live-cell imaging of nucleic acids using stimulated Raman scattering microscopy
- PMID: 22368112
- PMCID: PMC3516876
- DOI: 10.1002/cphc.201100890
Label-free live-cell imaging of nucleic acids using stimulated Raman scattering microscopy
Abstract
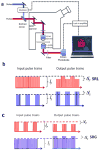
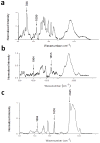
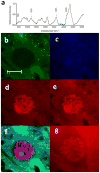
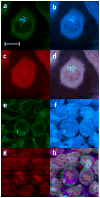
Imaging of nucleic acids is important for studying cellular processes such as cell division and apoptosis. A noninvasive label-free technique is attractive. Raman spectroscopy provides rich chemical information based on specific vibrational peaks. However, the signal from spontaneous Raman scattering is weak and long integration times are required, which drastically limits the imaging speed when used for microscopy. Coherent Raman scattering techniques, comprising coherent anti-Stokes Raman scattering (CARS) and stimulated Raman scattering (SRS) microscopy, overcome this problem by enhancing the signal level by up to five orders of magnitude. CARS microscopy suffers from a nonresonant background signal, which distorts Raman spectra and limits sensitivity. This makes CARS imaging of weak transitions in spectrally congested regions challenging. This is especially the case in the fingerprint region, where nucleic acids show characteristic peaks. The recently developed SRS microscopy is free from these limitations; excitation spectra are identical to those of spontaneous Raman and sensitivity is close to shot-noise limited. Herein we demonstrate the use of SRS imaging in the fingerprint region to map the distribution of nucleic acids in addition to proteins and lipids in single salivary gland cells of Drosophila larvae, and in single mammalian cells. This allows the imaging of DNA condensation associated with cell division and opens up possibilities of imaging such processes in vivo.
Copyright © 2012 WILEY-VCH Verlag GmbH & Co. KGaA, Weinheim.
Figures


Similar articles
-
Fast vibrational imaging of single cells and tissues by stimulated Raman scattering microscopy.Acc Chem Res. 2014 Aug 19;47(8):2282-90. doi: 10.1021/ar400331q. Epub 2014 May 28. Acc Chem Res. 2014. PMID: 24871269 Free PMC article.
-
Label-free DNA imaging in vivo with stimulated Raman scattering microscopy.Proc Natl Acad Sci U S A. 2015 Sep 15;112(37):11624-9. doi: 10.1073/pnas.1515121112. Epub 2015 Aug 31. Proc Natl Acad Sci U S A. 2015. PMID: 26324899 Free PMC article.
-
Label-free imaging of biomolecules in food products using stimulated Raman microscopy.J Biomed Opt. 2011 Feb;16(2):021118. J Biomed Opt. 2011. PMID: 21473164
-
Mammalian cell and tissue imaging using Raman and coherent Raman microscopy.Wiley Interdiscip Rev Syst Biol Med. 2020 Nov;12(6):e1501. doi: 10.1002/wsbm.1501. Epub 2020 Jul 19. Wiley Interdiscip Rev Syst Biol Med. 2020. PMID: 32686297 Free PMC article. Review.
-
Label-free imaging of lipid dynamics using Coherent Anti-stokes Raman Scattering (CARS) and Stimulated Raman Scattering (SRS) microscopy.Curr Opin Genet Dev. 2011 Oct;21(5):585-90. doi: 10.1016/j.gde.2011.09.003. Epub 2011 Sep 22. Curr Opin Genet Dev. 2011. PMID: 21945002 Free PMC article. Review.
Cited by
-
Pseudo-HE images derived from CARS/TPEF/SHG multimodal imaging in combination with Raman-spectroscopy as a pathological screening tool.BMC Cancer. 2016 Jul 26;16:534. doi: 10.1186/s12885-016-2520-x. BMC Cancer. 2016. PMID: 27460472 Free PMC article.
-
Denoising of stimulated Raman scattering microscopy images via deep learning.Biomed Opt Express. 2019 Jul 10;10(8):3860-3874. doi: 10.1364/BOE.10.003860. eCollection 2019 Aug 1. Biomed Opt Express. 2019. PMID: 31452980 Free PMC article.
-
Multiple Parallel Fusion Network for Predicting Protein Subcellular Localization from Stimulated Raman Scattering (SRS) Microscopy Images in Living Cells.Int J Mol Sci. 2022 Sep 16;23(18):10827. doi: 10.3390/ijms231810827. Int J Mol Sci. 2022. PMID: 36142736 Free PMC article.
-
Deciphering single cell metabolism by coherent Raman scattering microscopy.Curr Opin Chem Biol. 2016 Aug;33:46-57. doi: 10.1016/j.cbpa.2016.05.016. Epub 2016 Jun 8. Curr Opin Chem Biol. 2016. PMID: 27288951 Free PMC article. Review.
-
Advanced vibrational microscopes for life science.Nat Methods. 2025 May;22(5):912-927. doi: 10.1038/s41592-025-02655-w. Epub 2025 May 13. Nat Methods. 2025. PMID: 40360912 Review.
References
-
- Puppels GJ, de Mul FFM, Otto C, Greve J, Robert-Nicoud M, Arndt-Jovin DJ, Jovin TM. Nature. 1990;347:301–303. - PubMed
-
- Krafft C, Dietzek B, Popp J. Analyst. 2009;134(6):1046. - PubMed
-
- Fujita K, Smith NI. Molecules and Cells. 2008;26(6):530. - PubMed
-
- Swain RJ, Stevens MM. Biochemical Society Transactions. 2007;35:544. - PubMed
Publication types
MeSH terms
Substances
Grants and funding
LinkOut - more resources
Full Text Sources
Other Literature Sources
Molecular Biology Databases

