

A Bayesian approach to targeted experiment design
- PMID: 22368245
- PMCID: PMC3324513
- DOI: 10.1093/bioinformatics/bts092
A Bayesian approach to targeted experiment design
Abstract
Motivation: Systems biology employs mathematical modelling to further our understanding of biochemical pathways. Since the amount of experimental data on which the models are parameterized is often limited, these models exhibit large uncertainty in both parameters and predictions. Statistical methods can be used to select experiments that will reduce such uncertainty in an optimal manner. However, existing methods for optimal experiment design (OED) rely on assumptions that are inappropriate when data are scarce considering model complexity.
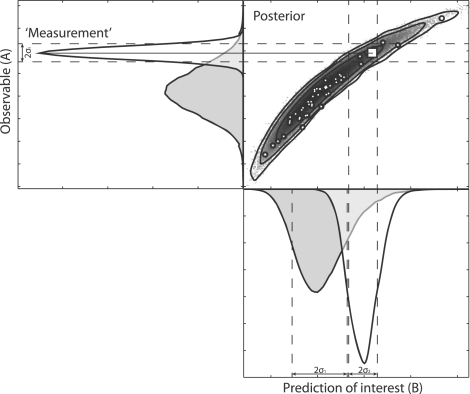
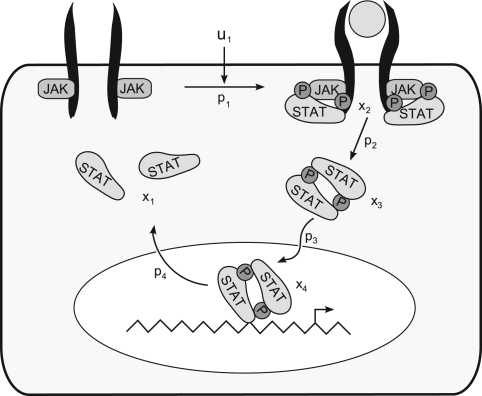
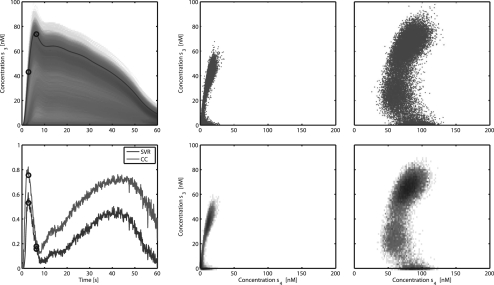
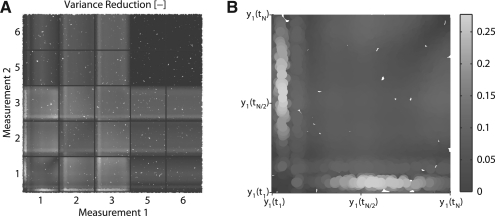
Results: We have developed a novel method to perform OED for models that cope with large parameter uncertainty. We employ a Bayesian approach involving importance sampling of the posterior predictive distribution to predict the efficacy of a new measurement at reducing the uncertainty of a selected prediction. We demonstrate the method by applying it to a case where we show that specific combinations of experiments result in more precise predictions.
Availability and implementation: Source code is available at: http://bmi.bmt.tue.nl/sysbio/software/pua.html.
Figures
Similar articles
-
An integrated strategy for prediction uncertainty analysis.Bioinformatics. 2012 Apr 15;28(8):1130-5. doi: 10.1093/bioinformatics/bts088. Epub 2012 Feb 21. Bioinformatics. 2012. PMID: 22355081 Free PMC article.
-
BioBayes: a software package for Bayesian inference in systems biology.Bioinformatics. 2008 Sep 1;24(17):1933-4. doi: 10.1093/bioinformatics/btn338. Epub 2008 Jul 16. Bioinformatics. 2008. PMID: 18632751
-
Parameter inference and model selection in signaling pathway models.Methods Mol Biol. 2010;673:283-95. doi: 10.1007/978-1-60761-842-3_18. Methods Mol Biol. 2010. PMID: 20835806 Review.
-
High-dimensional Bayesian parameter estimation: case study for a model of JAK2/STAT5 signaling.Math Biosci. 2013 Dec;246(2):293-304. doi: 10.1016/j.mbs.2013.04.002. Epub 2013 Apr 16. Math Biosci. 2013. PMID: 23602931
-
Systems biology of JAK-STAT signalling in human malignancies.Prog Biophys Mol Biol. 2011 Aug;106(2):426-34. doi: 10.1016/j.pbiomolbio.2011.06.013. Epub 2011 Jul 6. Prog Biophys Mol Biol. 2011. PMID: 21762720 Review.
Cited by
-
Standing Variations Modeling Captures Inter-Individual Heterogeneity in a Deterministic Model of Prostate Cancer Response to Combination Therapy.Cancers (Basel). 2021 Apr 14;13(8):1872. doi: 10.3390/cancers13081872. Cancers (Basel). 2021. PMID: 33919753 Free PMC article.
-
Iterative experiment design guides the characterization of a light-inducible gene expression circuit.Proc Natl Acad Sci U S A. 2015 Jun 30;112(26):8148-53. doi: 10.1073/pnas.1423947112. Epub 2015 Jun 17. Proc Natl Acad Sci U S A. 2015. PMID: 26085136 Free PMC article.
-
PEITH(Θ): perfecting experiments with information theory in Python with GPU support.Bioinformatics. 2018 Apr 1;34(7):1249-1250. doi: 10.1093/bioinformatics/btx776. Bioinformatics. 2018. PMID: 29228182 Free PMC article.
-
Quantifying the relative importance of experimental data points in parameter estimation.BMC Syst Biol. 2018 Nov 22;12(Suppl 6):103. doi: 10.1186/s12918-018-0622-6. BMC Syst Biol. 2018. PMID: 30463558 Free PMC article.
-
Optimal experiment design for model selection in biochemical networks.BMC Syst Biol. 2014 Feb 20;8:20. doi: 10.1186/1752-0509-8-20. BMC Syst Biol. 2014. PMID: 24555498 Free PMC article.
References
-
- Brown K.S., Sethna J.P. Statistical mechanical approaches to models with many poorly known parameters. Phys. Rev. E. 2003;68:021904. - PubMed
-
- Casey F., et al. Optimal experimental design in an epidermal growth factor receptor signalling and down-regulation model. Syst. Biol. IET. 2007;1:190–202. - PubMed
-
- Cedersund G., Roll J. Systems biology: model based evaluation and comparison of potential explanations for given biological data. FEBS J. 2009;276:903–922. - PubMed
Publication types
MeSH terms
Substances
LinkOut - more resources
Full Text Sources
Other Literature Sources
