

HD2C interacts with HDA6 and is involved in ABA and salt stress response in Arabidopsis
- PMID: 22368268
- PMCID: PMC3350937
- DOI: 10.1093/jxb/ers059
HD2C interacts with HDA6 and is involved in ABA and salt stress response in Arabidopsis
Abstract
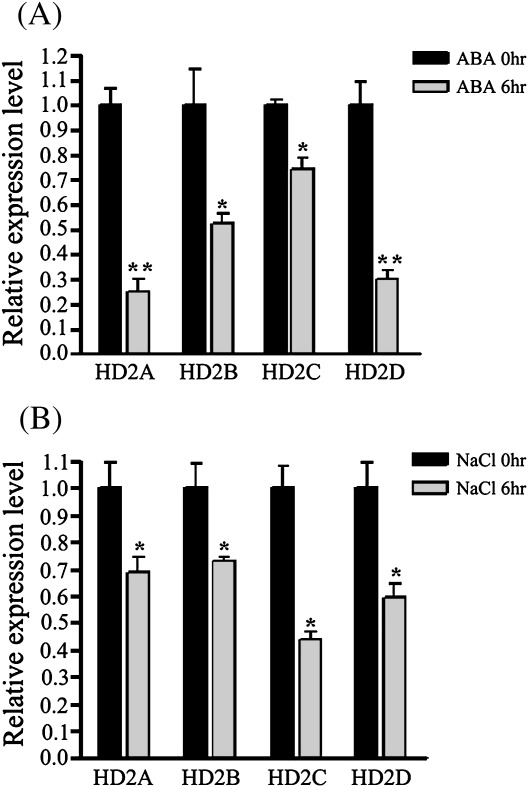
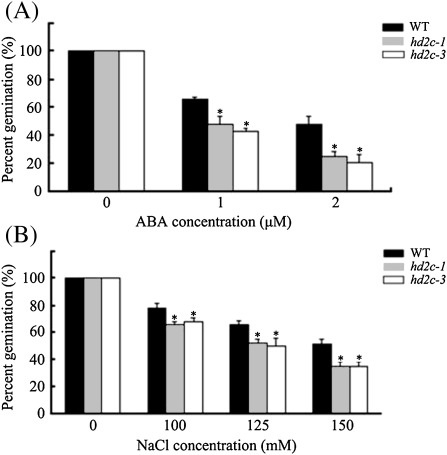
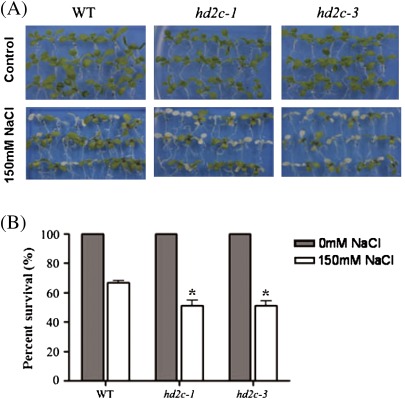
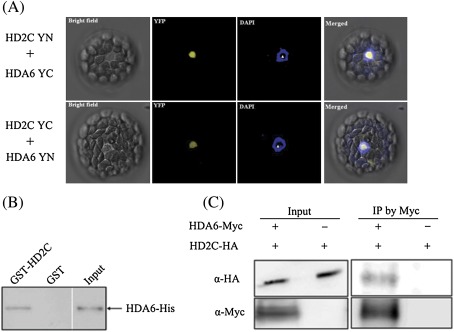
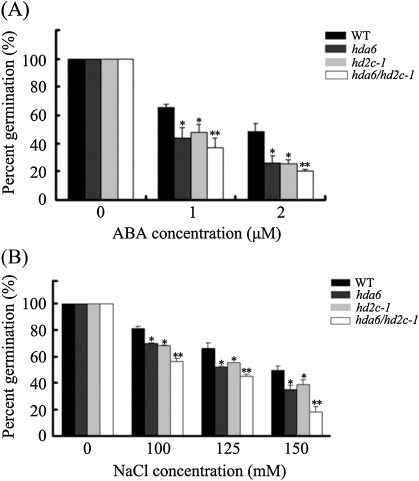
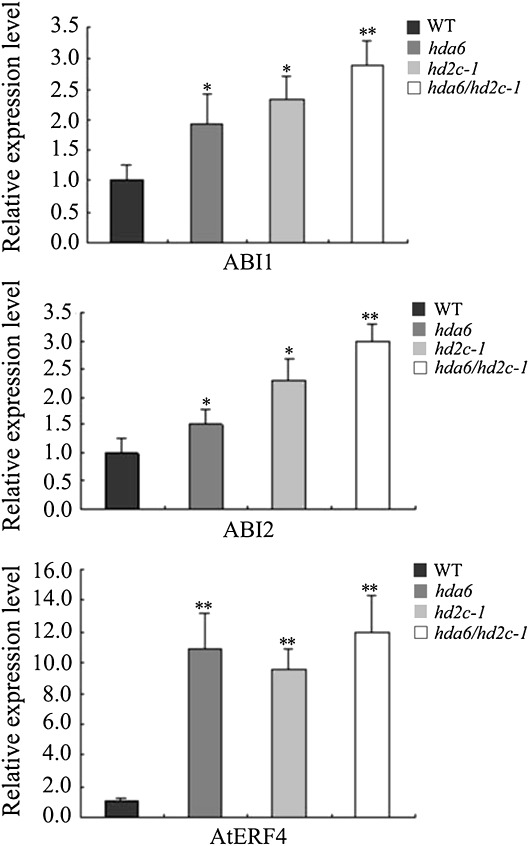
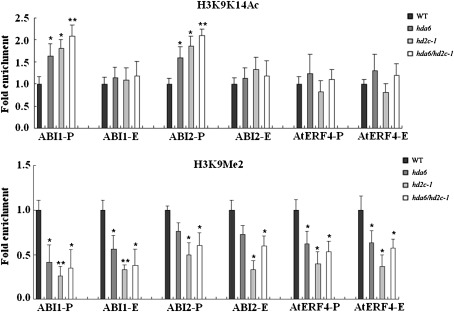
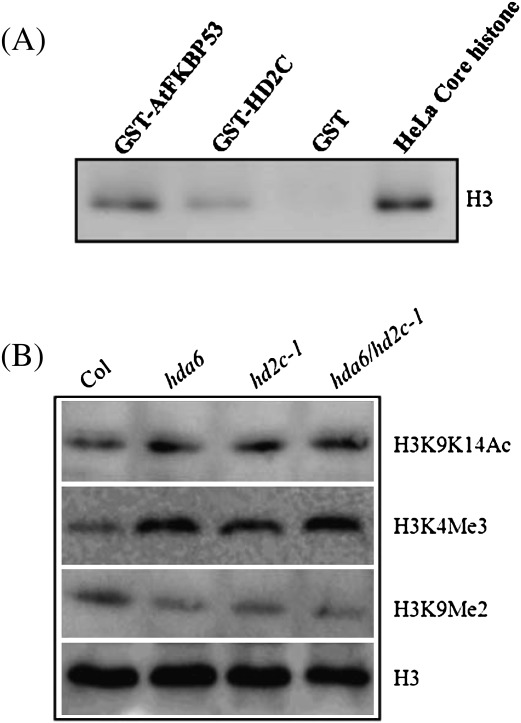
HD2 proteins are plant specific histone deacetylases. Four HD2 proteins, HD2A, HD2B, HD2C, and HD2D, have been identified in Arabidopsis. It was found that the expression of HD2A, HD2B, HD2C, and HD2D was repressed by ABA and NaCl. To investigate the function of HD2 proteins further, two HD2C T-DNA insertion lines of Arabidopsis, hd2c-1 and hd2c-3 were identified. Compared with wild-type plants, hd2c-1 and hd2c-3 plants displayed increased sensitivity to ABA and NaCl during germination and decreased tolerance to salt stress. These observations support a role of HD2C in the ABA and salt-stress response in Arabidopsis. Moreover, it was demonstrated that HD2C interacted physically with a RPD3-type histone deacetylase, HDA6, and bound to histone H3. The expression of ABA-responsive genes, ABI1 and ABI2, was increased in hda6, hd2c, and hda6/hd2c-1 double mutant plants, which was associated with increased histone H3K9K14 acetylation and decreased histone H3K9 dimethylation. Taken together, our results suggested that HD2C functionally associates with HDA6 and regulates gene expression through histone modifications.
Figures

Similar articles
-
Involvement of Arabidopsis histone deacetylase HDA6 in ABA and salt stress response.J Exp Bot. 2010 Jul;61(12):3345-53. doi: 10.1093/jxb/erq154. Epub 2010 Jun 2. J Exp Bot. 2010. PMID: 20519338 Free PMC article.
-
Role of histone deacetylases HDA6 and HDA19 in ABA and abiotic stress response.Plant Signal Behav. 2010 Oct;5(10):1318-20. doi: 10.4161/psb.5.10.13168. Epub 2010 Oct 1. Plant Signal Behav. 2010. PMID: 20930557 Free PMC article.
-
Expression and function of HD2-type histone deacetylases in Arabidopsis development.Plant J. 2004 Jun;38(5):715-24. doi: 10.1111/j.1365-313X.2004.02083.x. Plant J. 2004. PMID: 15144374
-
Epigenetic interplay of histone modifications and DNA methylation mediated by HDA6.Plant Signal Behav. 2012 Jun;7(6):633-5. doi: 10.4161/psb.19994. Epub 2012 May 14. Plant Signal Behav. 2012. PMID: 22580702 Free PMC article. Review.
-
HD2-type histone deacetylases: unique regulators of plant development and stress responses.Plant Cell Rep. 2021 Sep;40(9):1603-1615. doi: 10.1007/s00299-021-02688-3. Epub 2021 May 26. Plant Cell Rep. 2021. PMID: 34041586 Review.
Cited by
-
Effect of nitric oxide on gene transcription - S-nitrosylation of nuclear proteins.Front Plant Sci. 2013 Aug 1;4:293. doi: 10.3389/fpls.2013.00293. eCollection 2013. Front Plant Sci. 2013. PMID: 23914201 Free PMC article.
-
Transcriptional Stress Memory and Transgenerational Inheritance of Drought Tolerance in Plants.Int J Mol Sci. 2022 Oct 26;23(21):12918. doi: 10.3390/ijms232112918. Int J Mol Sci. 2022. PMID: 36361708 Free PMC article. Review.
-
Structural and chemical biology of deacetylases for carbohydrates, proteins, small molecules and histones.Commun Biol. 2018 Dec 5;1:217. doi: 10.1038/s42003-018-0214-4. eCollection 2018. Commun Biol. 2018. PMID: 30534609 Free PMC article. Review.
-
Simulated microgravity, Mars gravity, and 2g hypergravity affect cell cycle regulation, ribosome biogenesis, and epigenetics in Arabidopsis cell cultures.Sci Rep. 2018 Apr 23;8(1):6424. doi: 10.1038/s41598-018-24942-7. Sci Rep. 2018. PMID: 29686401 Free PMC article.
-
Epigenetic switch from repressive to permissive chromatin in response to cold stress.Proc Natl Acad Sci U S A. 2018 Jun 5;115(23):E5400-E5409. doi: 10.1073/pnas.1721241115. Epub 2018 May 21. Proc Natl Acad Sci U S A. 2018. PMID: 29784800 Free PMC article.
References
-
- Aravind L. Second family of histone deacetylases. Science. 1998;280:1167.
-
- Berger SL. Histone modifications in transcriptional regulation. Current Opinion in Genetics and Development. 2002;12:142–148. - PubMed
-
- Brosch G, Lusser A, Goralik-Schramel M, Loidl P. Purification and characterization of a high molecular weight histone deacetylase complex (HD2) of maize embryos. Biochemistry. 1996;35:15907–15914. - PubMed
Publication types
MeSH terms
Substances
LinkOut - more resources
Full Text Sources
Other Literature Sources
Molecular Biology Databases
Miscellaneous
