. 2011 Dec 22;12 Suppl 4(Suppl 4):S2.
doi: 10.1186/1471-2164-12-S4-S2. Epub 2011 Dec 22.

Amino acids biosynthesis and nitrogen assimilation pathways: a great genomic deletion during eukaryotes evolution

Affiliations

Amino acids biosynthesis and nitrogen assimilation pathways: a great genomic deletion during eukaryotes evolution

R L M Guedes et al. BMC Genomics. .

Abstract

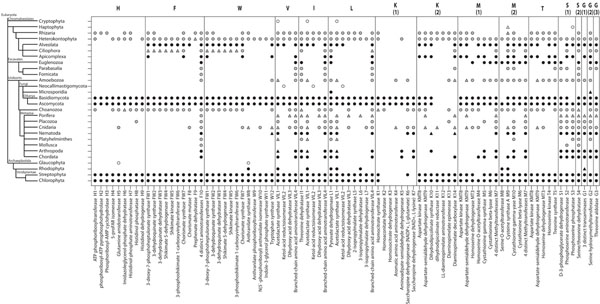
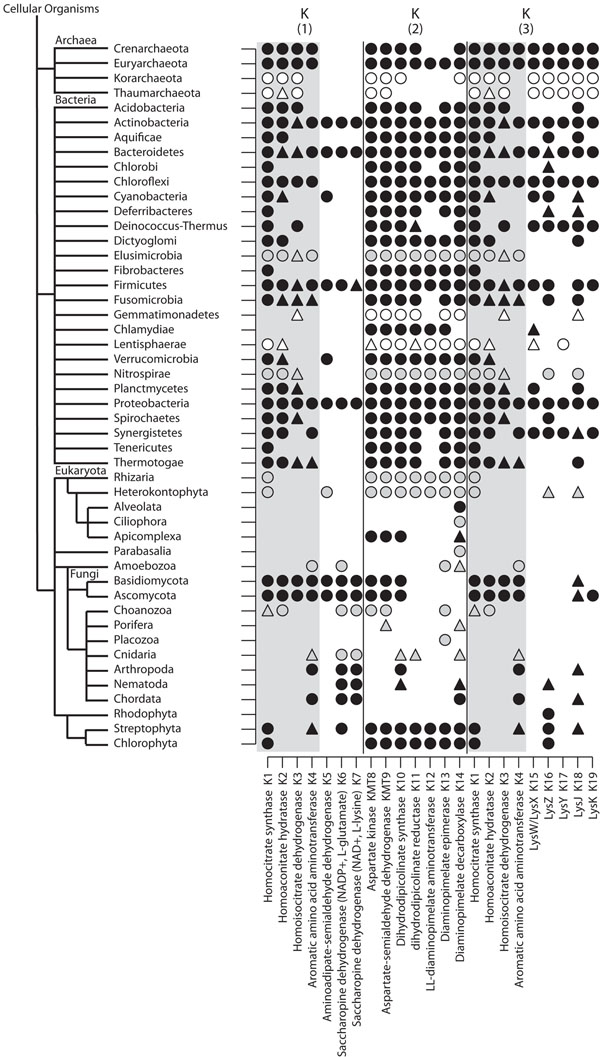
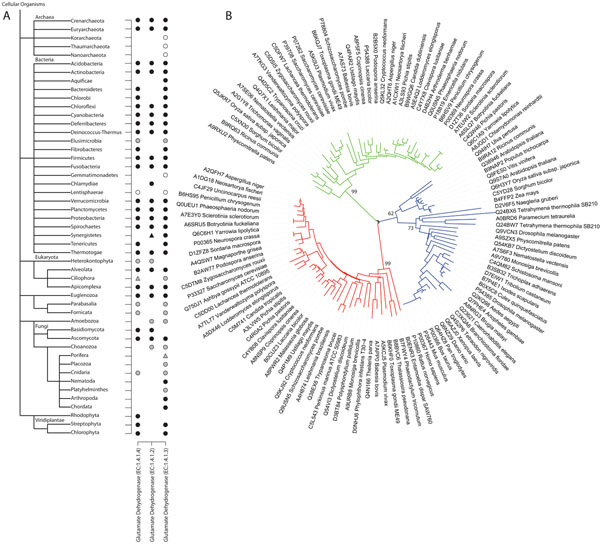
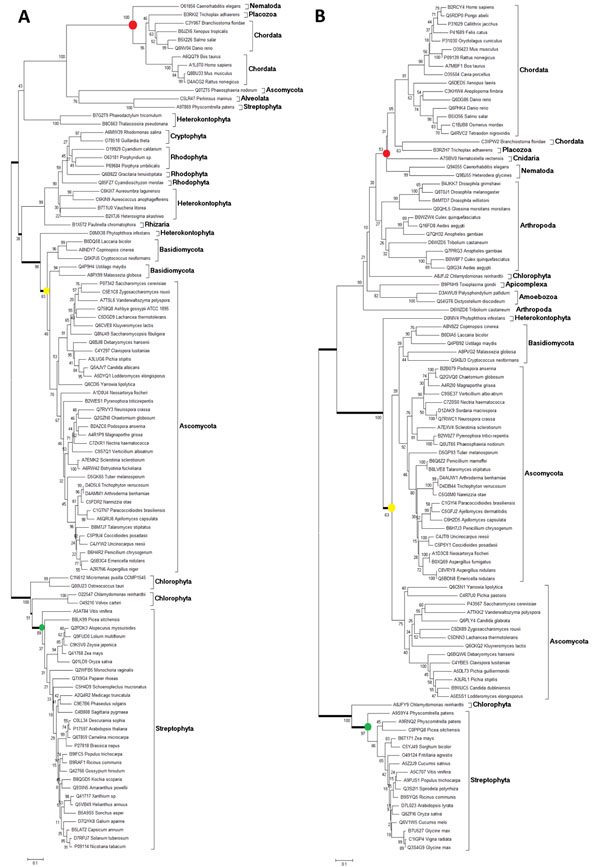
Background: Besides being building blocks for proteins, amino acids are also key metabolic intermediates in living cells. Surprisingly a variety of organisms are incapable of synthesizing some of them, thus named Essential Amino Acids (EAAs). How certain ancestral organisms successfully competed for survival after losing key genes involved in amino acids anabolism remains an open question. Comparative genomics searches on current protein databases including sequences from both complete and incomplete genomes among diverse taxonomic groups help us to understand amino acids auxotrophy distribution.

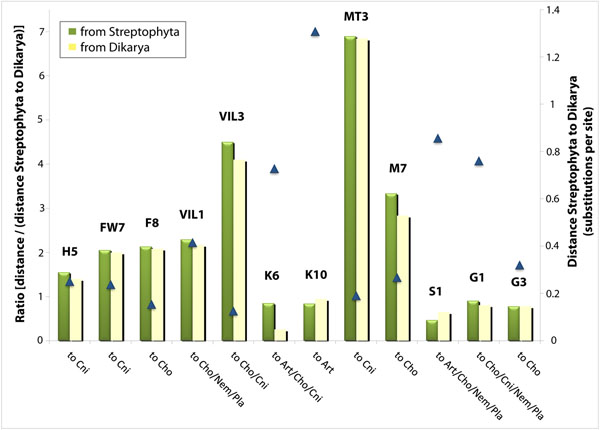
Results: Here, we applied a methodology based on clustering of homologous genes to seed sequences from autotrophic organisms Saccharomyces cerevisiae (yeast) and Arabidopsis thaliana (plant). Thus we depict evidences of presence/absence of EAA biosynthetic and nitrogen assimilation enzymes at phyla level. Results show broad loss of the phenotype of EAAs biosynthesis in several groups of eukaryotes, followed by multiple secondary gene losses. A subsequent inability for nitrogen assimilation is observed in derived metazoans.

Conclusions: A Great Deletion model is proposed here as a broad phenomenon generating the phenotype of amino acids essentiality followed, in metazoans, by organic nitrogen dependency. This phenomenon is probably associated to a relaxed selective pressure conferred by heterotrophy and, taking advantage of available homologous clustering tools, a complete and updated picture of it is provided.


Figures

Figure 1
Figure 1
Essential amino acid anabolic pathways. Schematic representation for presence/absence of anabolic enzymes for nine essential amino acids and the non-essential amino acids serine and glycine. Eukaryotic taxonomic tree displayed at phyla level. Circles represent detection of complete proteins and triangles detection of complete and fragmented proteins. Black: phyla containing complete genomes; Grey: at most organisms with draft genomes; White: phyla with no complete or draft genomes. Saccharomyces cerevisiae (Ascomycota) and Arabidopsis thaliana (Streptophyta) were used as seeds. The 4 distinct aminotransferases in phenylalanine pathway are: (i) aspartate aminotransferase (ii) histidinol-phosphate aminotransferase (iii) aromatic amino acid aminotransferase (iv) tyrosine aminotransferase. The 4 distinct methyltransferases in methionine pathway are: (i) 5-methyltetrahydropteroyltriglutamate--homocysteine methyltransferase (ii) homocysteine S-methyltransferase (iii) betaine-homocysteine methyltransferase (iv) 5-methyltetrahydrofolate--homocysteine methyltransferase. The 3 distinct transaminases in glycine pathway are: alanine-glyoxylate transaminase, serine-glyoxylate transaminase and serine-pyruvate transaminase.
Figure 2
Figure 2
Lysine anabolic pathways. Schematic representation for presence/absence of enzymes involved in lysine biosynthesis. K(1) represents Fungi α-aminoadipate (AAA) pathway; K(2) bacteria, plants, and algae diaminopimelate (DAP) pathway; K(3) archaea α-aminoadipate (AAA) variant pathway. Taxonomic tree displayed at phyla level. Circles represent detection of complete proteins and triangles detection of complete and fragmented proteins. Colors are as for Figure 1. Saccharomyces cerevisiae (Ascomycota), Arabidopsis thaliana (Streptophyta) and Pyrococcus horikoshii (Euryarchaeota) were used as seeds.
Figure 3
Figure 3
Glutamate dehydrogenases. Schematic representation for presence/absence of glutamate dehydrogenases. A: Left column: assimilative GDH1 and GDH3 from Saccharomyces cerevisiae and putative GDH from Arabdopsis thaliana; Central column: catabolic GDH2 from Saccharomyces cerevisiae; Right column: catabolic GDH1, GDH2 and GDH3 from Arabdopsis thaliana. Taxonomic tree displayed at phyla level. Circles represent detection of complete proteins and triangles detection of complete and fragmented proteins. Colors are as for Figure 1. Saccharomyces cerevisiae (Ascomycota) and Arabidopsis thaliana (Streptophyta) were used as seeds. B: Phylogenetic tree with eukaryotic sequences from glutamate dehydrogenase isoforms. Green branches: EC1.4.1.4; Red branches: EC:1.4.1.2; Blue branches: EC:1.4.1.3.
Figure 4
Figure 4
Phylogenetic analyses for EAA and NEAA enzymes. Phylogenetic trees for (A) acetolactate synthase (VIL1 code in Figure 1), an enzyme for EAA valine, isoleucine and leucine biosynthesis and (B) a group of alanine-glyoxylate, serine-glyoxylate and serine-pyruvate transaminases (G1 code in Figure 1), a NEAA biosynthetic enzyme for glycine biosynthesis. The green, yellow and red circles are marking the plant (Streptophyta), fungi (Dikarya) and animals (Metazoa) branches, respectively. In (A), the distance (given by substitutions per site) from the green circle to the yellow and red circles are, respectively, 0.4 and 1.0. In (B), these values are, respectively, 0.7 and 0.7.
Figure 5
Figure 5
Relative distance of Metazoa enzymes from homologues of EAA and from NEAA biosynthetic enzymes present in plant and fungi. Phylogenetic trees were obtained for 12 enzymes, using all eukaryotic clustered proteins. Codes for enzymes are the same as in Figure 1 and are shown over the bars. For normalization, a background distance from the plant phylum Streptophyta to the fungi subkingdom Dikarya was measured and represented by triangles (right Y axis). The distance “from” either Streptophyta (green bars) or Dikarya (yellow bars), “to” the branches that group the clades indicated below the bars, were measured and normalized by the distance Streptophyta/Dikarya, yielding the ratio represented by bars (left Y axis). Only the three enzymes on the right (S1, G1 and G2) participate of biosynthesis of NEAAs: serine (S1) and glycine (G1 and G2). K6 and K10 are enzymes that compose lysine biosynthetic pathways which are not complete, respectively, in Streptophyta or Dikarya (see Figure 1). Abbreviations: Art, Arthropoda; Cho, Choanozoa; Cni, Cnidaria; Nem, Nematoda; Pla, Placozoa.

References

    1. Blair J, Shah P, Hedges SB. Evolutionary sequence analysis of complete eukaryote genomes. BMC Bioinformatics. 2005;6:53. doi: 10.1186/1471-2105-6-53. - DOI - PMC - PubMed
    1. Cunchillos C, Lecointre G. Early steps of metabolism evolution inferred by cladistic analysis of amino acid catabolic pathways. Comptes Rendus Biologies. 2002;325:119–129. doi: 10.1016/S1631-0691(02)01411-7. - DOI - PubMed
    1. Cunchillos C, Lecointre G. Ordering events of biochemical evolution. Biochimie. 2007;89:555–573. doi: 10.1016/j.biochi.2006.12.007. - DOI - PubMed
    1. Hernández-Montes G, Díaz-Mejía JJ, Pérez-Rueda E, Segovia L. The hidden universal distribution of amino acid biosynthetic networks: a genomic perspective on their origins and evolution. Genome Biol. 2008;9:R95. doi: 10.1186/gb-2008-9-6-r95. - DOI - PMC - PubMed
    1. Reeds PJ, Wahle KWJ, Haggarty P. Energy costs of protein and fatty acid synthesis. Proceedings of the Nutrition Society. 1982;41:155–159. doi: 10.1079/PNS19820025. - DOI - PubMed

Publication types

LinkOut - more resources