. 2012 Mar 12;209(3):597-606.
doi: 10.1084/jem.20111696. Epub 2012 Feb 27.

A germinal center-independent pathway generates unswitched memory B cells early in the primary response

Affiliations

A germinal center-independent pathway generates unswitched memory B cells early in the primary response

Justin J Taylor et al. J Exp Med. .

Abstract

Memory B cells can be produced from the classical germinal center (GC) pathway or a less understood GC-independent route. We used antigen-based cell enrichment to assess the relative contributions of these pathways to the polyclonal memory B cell pool. We identified a CD38(+) GL7(+) B cell precursor population that differentiated directly into IgM(+) or isotype-switched (sw) Ig(+) memory B cells in a GC-independent fashion in response to strong CD40 stimulation. Alternatively, CD38(+) GL7(+) B cell precursors had the potential to become Bcl-6(+) GC cells that then generated primarily swIg(+) memory B cells. These results demonstrate that early IgM(+) and swIg(+) memory B cells are products of a GC-independent pathway, whereas later switched Ig(+) memory B cells are products of GC cells.


Figures

Figure 1.
Figure 1.
Early kinetics of the PE-specific B cell response. (A) Representative flow cytometry analysis of PE-specific B cells found in various lymphoid organs 29 d after s.c. injection of animals with 15 µg PE emulsified in CFA (PE/CFA) in the base of the tail and in the absence of injection. Each sample was analyzed directly ex vivo (top) or after ex vivo enrichment of PE-binding cells using anti-PE magnetic microbeads (bottom). The dots plots show B cells identified by flow cytometry in pooled spleen and LN samples as cells that stained with anti-B220 but not anti-Thy1.2, CD11c, Gr-1, or F4/80. Ing, inguinal LN; Peri LN, periaortic LN; Ax, axillary LN; Br, brachial LN; Cerv, cervical LN; Mes LN, mesenteric LN. Shown is a representative of two similar experiments. (B) Representative flow cytometry analysis of CD38 and GL7 expression by PE+ B cells 29 d after injection of PE/CFA, along with the total number of donor PE-specific memory (CD38+ GL7) and GC (CD38 GL7+) B cells in the specified lymphoid organs. Each point represents an individual mouse and the bars represent the means (n = 3). Shown is a representative of two similar experiments.
Figure 2.
Figure 2.
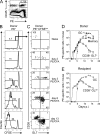
Early kinetics of the PE-specific B cell response. (A) Representative flow cytometry analysis showing the identification of donor CD45.1+ PE-specific B cells in the total B cell population (B220+, CD11c, Gr-1, and F4/80) in a PE-enriched sample. (B) Representative flow cytometry analysis of CFSE dilution within donor PE-specific cells at the indicated time points after injection and without injection. p.i., post injection. (C) Representative flow cytometry analysis of CD38 and GL7 expression within CFSElow donor PE+ cells at the indicated time points after injection. (D) Combined data from 10 experiments showing the total number of donor PE-specific memory (CD38+ GL7), GC (CD38 GL7+), and CD38+ GL7+ populations identified as shown in C, or using CellTrace violet instead of CFSE. The mean and SEM (n = 3–7) are shown for all time points. The mean number of cells in each population calculated in unimmunized mice (n = 8) was considered background and was subtracted from the displayed values. (E) Combined data from 10 experiments showing the total number of recipient (CD45.1) PE-specific GC (CD38 GL7+) and CD38+ GL7+ cells. The mean and SEM (n = 3–14) are shown for all time points.
Figure 3.
Figure 3.
Co-localization of PE binding and GL7 staining B cells in situ. Sections of draining LN were stained with PE, followed by antibodies specific for GL7 (green), IgD (purple), Thy1.2 (blue), or PE (red). LN sections were from an unimmunized mouse (A) or from mice 4 d (B–E) or 14 d (G) after injection. Arrows in B show PE+ GL7+ cells (yellow) present at the T/B border. A close-up of a 4 d T/B border region shows the overlay of all colors (C), PE only (D), or GL7 only (E) with an arrow pointing to a double staining GL7+ PE+ cell. (F) The graph shows the percentage of the PE+ cells that were in the follicles or at the T/B border in sections of draining LN taken from PE/CFA-injected mice on day 4. The percentage of GL7+ PE+ cells is depicted with an empty bar and the percentage of GL7 PE+ cells is depicted with a filled bar. The T/B border was identified as a swath, 8–10 cells wide, where the IgD and Thy1.2 staining were mixed. The T cell areas, medullary chords, or any region not clearly resolved as follicle or T/B border were excluded from the analysis. 84 PE+ cells were counted in sections taken from 10 LNs obtained from five individual mice.
Figure 4.
Figure 4.
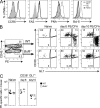
CD38+ GL7+ cells are distinct from GC cells. (A) Representative flow cytometry analysis of CCR6, FAS, PNA, and Bcl-6 expression on PE-specific naive (gray) or CD38+ GL7+ (solid line) or CD38 GL7+ (dashed line) GC cells, 6 or 7 d after injection. Each marker was analyzed in at least three animals. (B) Representative flow cytometry analysis of CD38 and GL7 expression by PE-specific B cells in PE-enriched samples from mixed bone marrow chimeras containing CD45.1+ WT and Bcl6−/− cells at the noted times after injection. (C) Combined data from three experiments showing the total number of naive PE-specific WT and Bcl6−/− B cells in uninjected chimeras and CD38+ GL7+ B cells in chimeras injected with PE/CFA. Numbers are corrected for chimerism based on the ratio of WT and Bcl6−/− B cells that did not bind PE. The bars represent the means.
Figure 5.
Figure 5.
CD38+ GL7+ cells directly give rise to memory cells and GC cells. 4 d after injection with PE/CFA, total GL7+ cells from CD45.1+ animals were FACS purified and adoptively transferred into CD45.2+ recipients. (A) Representative flow cytometry plots showing the expression of CD38 and GL7 on PE-specific B cells at the time of adoptive transfer. (B) Representative flow cytometry analysis of CD38 and GL7 expression by the donor CD45.1+ PE-specific B cells 2 or 4 d after adoptive transfer into mice injected with PE and CFA or CFA alone at the same time as the donor animals. Data from two individual animals was concatenated for display. (C) Combined data from four experiments showing the total number of PE+ donor memory (CD38+ GL7), GC (CD38 GL7+), and CD38+ GL7+ cells 2 and 4 d after transfer into uninjected mice or those injected with PE/CFA or CFA alone. The mean and SEM (n = 3–7) are shown.
Figure 6.
Figure 6.
Quantifying GC-derived and GC-independent memory B cells. (A) Representative flow cytometry plots showing the expression of isotype switched (IgG+IgA+IgE+) and unswitched (IgM+IgD+) Ig on PE-specific WT and Bcl6−/− memory populations (CD38+ GL7) in WT:Bcl6−/− mixed chimeras at the indicated time points after injection. p.i., post injection. Combined data from five experiments showing the numbers of PE-specific WT and Bcl6−/− (B) IgM+ memory and swIg+ (C) memory cells. The mean and SEM (n = 3–5) are shown for all time points.
Figure 7.
Figure 7.
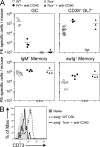
CD73 expression identifies most GC-derived memory B cells. (A) Representative flow cytometry plots from WT:Bcl6−/− mixed chimeras showing the expression of CD73 on PE-specific WT and Bcl6−/− IgM+ and swIg+ memory populations 30 d after injection, and the naive PE-specific cells found in uninjected mice. (B) Combined data from two experiments showing the numbers of PE-specific WT and Bcl6−/− CD73 and CD73+ memory populations 31 d after injection. (C) Numbers of PE-specific CD73 and CD73+ memory populations 31 d after injection, treated with or without anti-CD40L beginning on day 5. The bars in B and C indicate the means. P-values are shown for the indicated comparisons.
Figure 8.
Figure 8.
Quantifying CD73 and CD73+ memory B cells. Combined data from five experiments showing the numbers of PE-specific (A) GC cells, IgM+ CD73 and CD73+ memory cells (B), or swIg+ CD73 and CD73+ memory cells (C) at the indicated time points after injection. (D) Combined data from multiple experiments showing the numbers of CD73 and total (CD73 + CD73+) PE-specific memory cells and at days 6, 10, and 30. The mean and SEM (n = 3–6) are shown for A–D. (E) Combined data from two experiments showing the numbers of IgM+ CD73, IgM+ CD73+, swIg+ CD73, and swIg+ CD73+ memory cells 60 d after injection with 1.5, 15, or 150 µg PE in CFA or 15 µg PE adsorbed to alum. To account for unstimulated naive cells contaminating the IgM+ CD73 population, the mean number of PE-specific cells found in unimmunized animals was subtracted from the IgM+ CD73 population. The means and SEM (n = 3–6) are shown.
Figure 9.
Figure 9.
Agonistic CD40 stimulation induces GC-independent memory cell generation in the absence of T cells. (A) Combined data from three experiments showing the numbers of PE-specific GC, CD38+ GL7+ cells, IgM+ memory, and swIg+ memory cells in WT and Tcra−/− mice with or without treatment with 250 µg anti-CD40 every other day beginning at the time of PE/CFA injection. The numbers of CD38+ GL7+ cells were calculated 6 d after injection, whereas the other populations were assessed at 9 d. To account for unstimulated naive cells contaminating the IgM+ memory population, the mean number of PE-specific cells found in uninjected animals was subtracted from the IgM+ population. Each data point represents an individual mouse and bars represent the mean. (B) Representative flow cytometry plots showing the expression of CD73 on PE-specific naive cells or swIg+ memory cells found in anti-CD40–treated Tcra−/− mice 9 d after injection or WT mice 30 d after injection. Shown is a representative of three animals.

Comment in

References

    1. Anderson S.M., Tomayko M.M., Ahuja A., Haberman A.M., Shlomchik M.J. 2007. New markers for murine memory B cells that define mutated and unmutated subsets. J. Exp. Med. 204:2103–2114 10.1084/jem.20062571 - DOI - PMC - PubMed
    1. Benson M.J., Elgueta R., Schpero W., Molloy M., Zhang W., Usherwood E., Noelle R.J. 2009. Distinction of the memory B cell response to cognate antigen versus bystander inflammatory signals. J. Exp. Med. 206:2013–2025 10.1084/jem.20090667 - DOI - PMC - PubMed
    1. Blink E.J., Light A., Kallies A., Nutt S.L., Hodgkin P.D., Tarlinton D.M. 2005. Early appearance of germinal center–derived memory B cells and plasma cells in blood after primary immunization. J. Exp. Med. 201:545–554 10.1084/jem.20042060 - DOI - PMC - PubMed
    1. Chan T.D., Gatto D., Wood K., Camidge T., Basten A., Brink R. 2009. Antigen affinity controls rapid T-dependent antibody production by driving the expansion rather than the differentiation or extrafollicular migration of early plasmablasts. J. Immunol. 183:3139–3149 10.4049/jimmunol.0901690 - DOI - PubMed
    1. Coffey F., Alabyev B., Manser T. 2009. Initial clonal expansion of germinal center B cells takes place at the perimeter of follicles. Immunity. 30:599–609 10.1016/j.immuni.2009.01.011 - DOI - PMC - PubMed

Publication types

MeSH terms