. 2012 Jul;26(7):1537-46.
doi: 10.1038/leu.2012.38. Epub 2012 Feb 10.

Overexpression of wild-type or mutants forms of CEBPA alter normal human hematopoiesis

Affiliations

Overexpression of wild-type or mutants forms of CEBPA alter normal human hematopoiesis

O Quintana-Bustamante et al. Leukemia. 2012 Jul.

Abstract

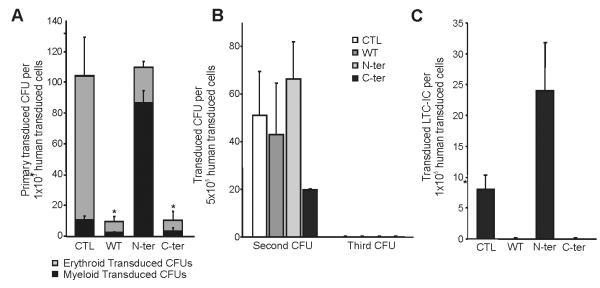
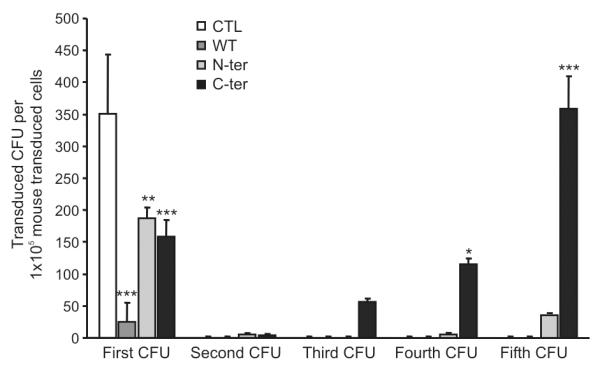
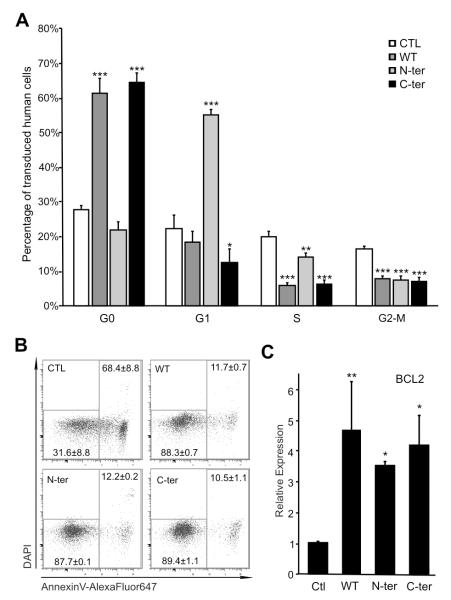
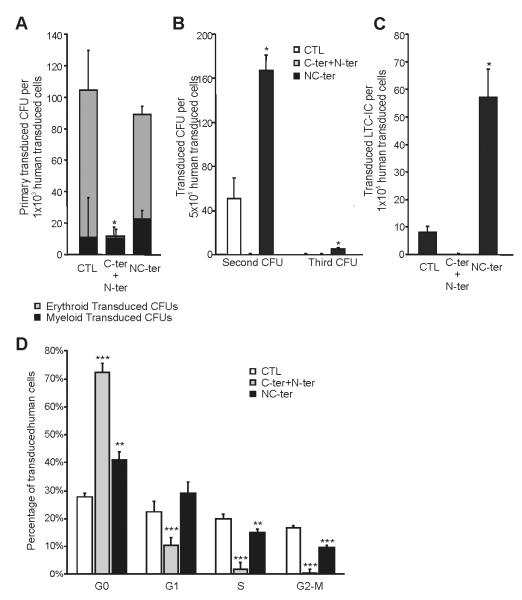
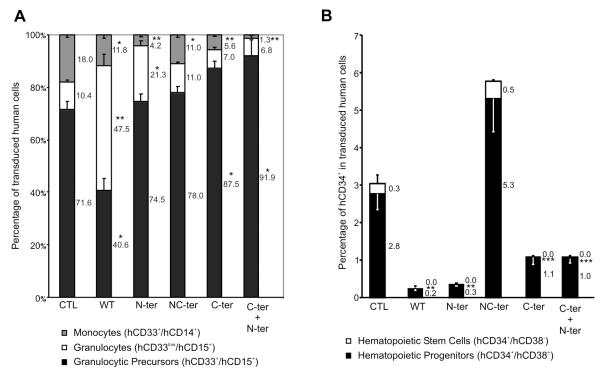
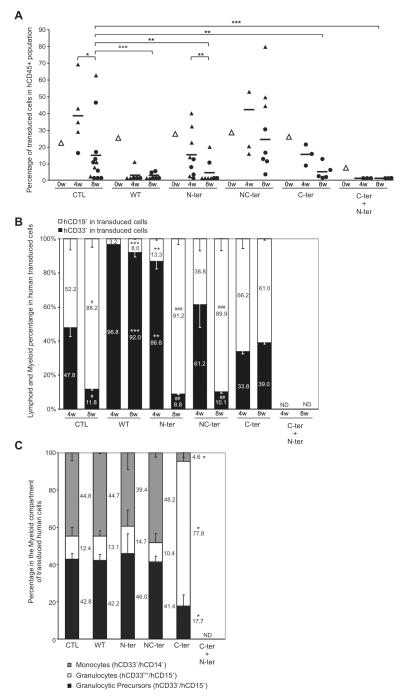
CCAAT/enhancer-binding protein-α (C/EBPα/CEBPA) is mutated in approximately 8% of acute myeloid leukemia (AML) in both familial and sporadic AML and, with FLT3 and NPM1, has received most attention as a predictive marker of outcome in patients with normal karyotype disease. Mutations clustering to either the N- or C-terminal (N- and C-ter) portions of the protein have different consequences on the protein function. In familial cases, the N-ter form is inherited with patients exhibiting long latency period before the onset of overt disease, typically with the acquisition of a C-ter mutation. Despite the essential insights murine models provide the functional consequences of wild-type C/EBPα in human hematopoiesis and how different mutations are involved in AML development have received less attention. Our data underline the critical role of C/EBPα in human hematopoiesis and demonstrate that C/EBPα mutations (alone or in combination) are insufficient to convert normal human hematopoietic stem/progenitor cells into leukemic-initiating cells, although individually each altered normal hematopoiesis. It provides the first insight into the effects of N- and C-ter mutations acting alone and to the combined effects of N/C double mutants. Our results mimicked closely what happens in CEBPA mutated patients.


Figures

Figure 1
Figure 1. Effect of different mutated forms of C/EBPα on human progenitors
A) Analysis of effect of expression of WT C/EBPα , mutated C/EBPα on N-terminal and on C-terminal on Human Hematopoietic progenitors by Colony Forming Units assay. 2×10³ human hematopoietic progenitors (Lin cells) after transduction were plated in H4434 medium; two weeks later number, type of CFUs and expression or not of GFP were determinate using an inverted fluorescent microscope. The number of erythroid (grey) and myeloid (black) colonies per transduced cells (GFP+) are reported. (B) Maintenance of Human Hematopoietic Progenitors by expression of C/EBPα mutant. Serial replating from primary or Secondary CFU assays were done to evaluate Secondary or Tertiary CFUs respectively. Each CFU assays was plated in H4434 medium and quantify after two weeks. Numbers of transduced CFU for Control, WT C/EBPα, N-terminal and C-terminal are represented. (C) Differences in Hematopoietic Stem Cells after transduction were determinate by Long Term Culture Initiating Cells (LTC-IC) assay. 1×10⁴ Human Lin cells, after transduction, were plated on irradiated stromal cell layer (M2-10B4 cell line) for five weeks, then preserved progenitors was evaluated by CFU assay in H4435 medium. Results are shown as mean ± standard deviation (SD), with significant differences of p ≤ 0.05, p ≤ 0.01 or p ≤ 0.001 are indicating by (*), (**) or (***) respectively. All the data are from a minimum of triplicates of two independent experiments.
Figure 2
Figure 2. Effect of different mutated forms of C/EBPα on mouse progenitors
Effect of expression of WT C/EBPα (dark grey bars), mutated C/EBPα on N-terminal (light grey) and on C-terminal (black) was evaluated on mouse hematopoietic progenitors by Colony Forming Units assay. 2×10³ mouse hematopoietic progenitors (mLin cells) after transduction were plated in M3434 medium; one week later number and type of CFUs were determinate. Serial replating was performed to evaluate secondary, tertiary, fourth or fifth CFUs respectively. Numbers of transduced CFU by Control (white bar), WT C/EBPα (dark grey), N-terminal (light grey) and C-terminal (black) are represented. The increase in colonies after serial replating observed could be explained by the presence of live immature cells in the methylcellulose, which were able after replating to mature and give rise to CFUs. Results are shown as mean ± standard deviation (SD), with significant differences of p ≤ 0.05, p ≤ 0.01 or p ≤ 0.001 are indicating by (*), (**) or (***) respectively.
Figure 3
Figure 3. Expression of WT and mutants C/EBPα modifies Proliferation and Apoptosis of Human Hematopoietic Progenitors
(A) Analysis of Cell Cycle of transduced cells at 2 weeks in culture. Different Cell Cycle Stages were identified by FACS according expression of Ki67 and DNA amount by DAPI. Cell Cycle profile of Human Lin- transduced by Control (white bars), WT C/EBPα (dark grey), N-terminal (light grey) and C-terminal (black) is shown. Data are from three independent experiments done for triplicate. (B) Transduction by different C/EBPα forms increases Human Lin- cell survival. Representative Dot-Plot representations of DAPI and Annexin V distinguish alive (left square) and dead cells (right square). Means ± SD are indicated. (C) Quantitative real-time PCR analysis of Bcl-2 in transduced Human Cells. Sorted transduced cells were analyzed in two independent experiments. Results are expressed as mean ± SD, with significant differences of p ≤ 0.05, p ≤ 0.01 or p ≤ 0.001 are indicating by (*), (**) or (***) respectively.
Figure 4
Figure 4. Biallelic and Double monoallelic mutations on C/EBPα modifies differently human progenitor compartment and Cell Cycle
(A) Effect of C-terminal with N-terminal mutated C/EBPα (biallelic mutations) or NC-terminal mutated C/EBPα (double monoallelic mutation) in Human Hematopoietic Progenitors were determines by CFU assays. The number of erythroid (grey) and myeloid (black) CFUs in the tranduced cells are presented. (B) Serial replating of Control, N-ter+C-ter or NC-ter mutated C/EBP transduced progenitors are presented. (C) LTC-IC assay to evaluate effect in HSC after expressing C-ter+N-ter or NC-ter C/EBPα. (D) Cell Cycle profile of control, N-ter + C-ter or NC-ter expressing after 14 days of culture. Results are shown as mean ± standard deviation (SD), with significant differences of p ≤ 0.05, p ≤ 0.01 or p ≤ 0.001 are indicating by (*), (**) or (***) respectively. All the data are from a minimum of triplicates of two independent experiments.
Figure 5
Figure 5. Modification of Myeloid Differentiation by of WT and mutants C/EBPα
(A). Human Lin cells were cultured in Myeloid Conditions for two weeks. FACS analysis evaluated percent of different populations of Myeloid Lineage in transduced cells: Monocytes (hCD33+/hCD14+, grey), Granulocytes (hCD33low/hCD15+, white) and Granulocytic precursors (hCD33+/hCD15+, black). (B) Percentage of CD34+CD38− (white) and CD34+CD38+ (black) in transduced cells after two weeks of culture in myeloid conditions. Percent of each subset is indicated. Data show triplicates of three independent experiments. Significant differences of p ≤ 0.05 or p ≤ 0.001 are indicating by (*) or (**) respectively.
Figure 6
Figure 6. WT and mutants C/EBPα Engraftment in Immunodeficient Mice
(A) In vivo kinetic of transduced cells in Human Hematopoietic population. Sub-lethally irradiated NOD/SCID/β2 microglobulin null mice (NOD/SCID/β2) were transplanted with Human Lin- cells after transduction. Percent of Transduced cells in human engraftment was analyzed at different time points by FACS. Transduction efficiency of transplanted populations (white triangle), mean of transduced cells percentage at different time points (black dash) and transduced cells percentage of individual mice (black triangle or circle) are shown. Animal analyzed at 4 or 8 weeks by bone marrow aspirations are identified by black triangles; circles indicated that the mice have been culled first and bone marrow cells flushed for the analysis. Data from two independent experiments are shown. (B) Hematopoietic lineage analysis of transduced cells in vivo at different time points. Bar graph showing percent of Lymphoid (hCD19+, white bars) and Myeloid (hCD33+, black bars) transduced cells. Numbers represent Myeloid-Lymphoid ratio in transduced human cells. (C) Percentage of transduced monocytes, granulocytes and granulocyte precursors present in the myeloid compartment of engrafted mice 8 weeks post-transplant. Numbers represent the ratio of each fraction in transduced human cells. Results are shown as mean ± SD. Data from four independent experiments are shown. Significant differences of p ≤ 0.05, p ≤ 0.01 or p ≤ 0.001 are indicating by (*), (**) or (***) respectively. ND, not detected.

Similar articles

Cited by

References

    1. Passegue E, Jamieson CH, Ailles LE, Weissman IL. Normal and leukemic hematopoiesis: are leukemias a stem cell disorder or a reacquisition of stem cell characteristics? Proc Natl Acad Sci U S A. 2003;100(Suppl 1):11842–11849. - PMC - PubMed
    1. Jordan CT, Guzman ML. Mechanisms controlling pathogenesis and survival of leukemic stem cells. Oncogene. 2004;23:7178–7187. - PubMed
    1. Warner JK, Wang JC, Hope KJ, Jin L, Dick JE. Concepts of human leukemic development. Oncogene. 2004;23:7164–7177. - PubMed
    1. Gililand G, Tallman MS. Focus on acute leukemias. Cancer Cell. 2002;1:417–420. - PubMed
    1. Pabst T, Mueller BU. Transcriptional dysregulation during myeloid transformation in AML. Oncogene. 2007;26:6829–6837. - PubMed

Publication types

MeSH terms