. 2012 Feb 26;30(3):271-7.
doi: 10.1038/nbt.2137.

Systematic dissection and optimization of inducible enhancers in human cells using a massively parallel reporter assay

Affiliations

Systematic dissection and optimization of inducible enhancers in human cells using a massively parallel reporter assay

Alexandre Melnikov et al. Nat Biotechnol. .

Abstract

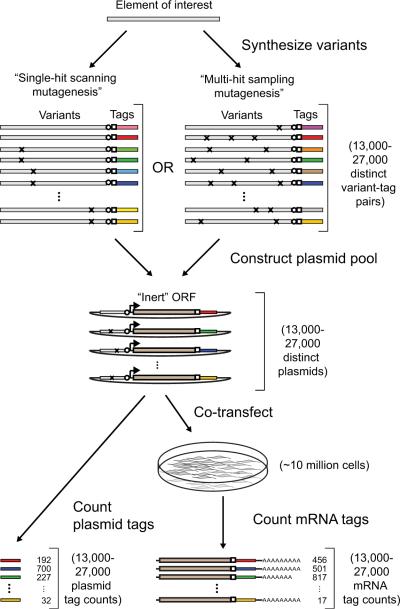
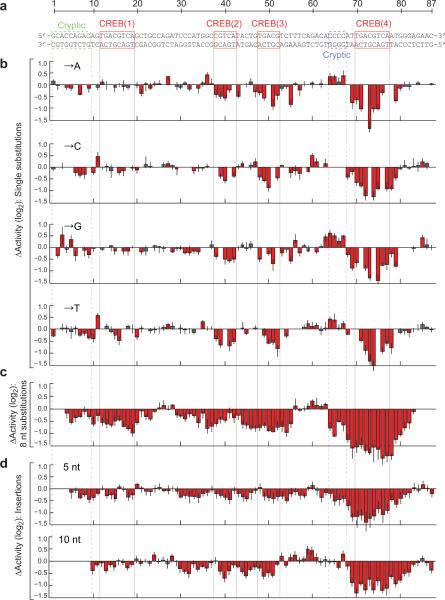
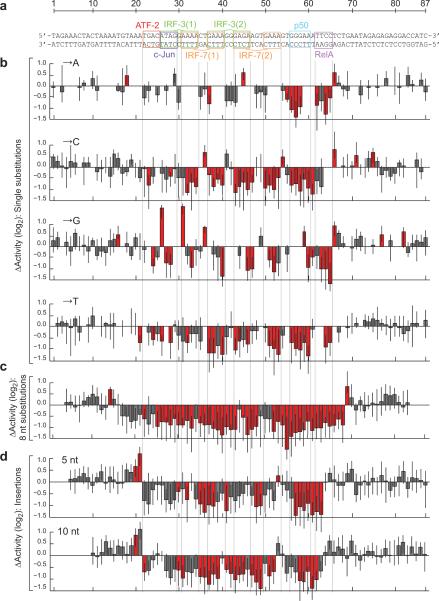
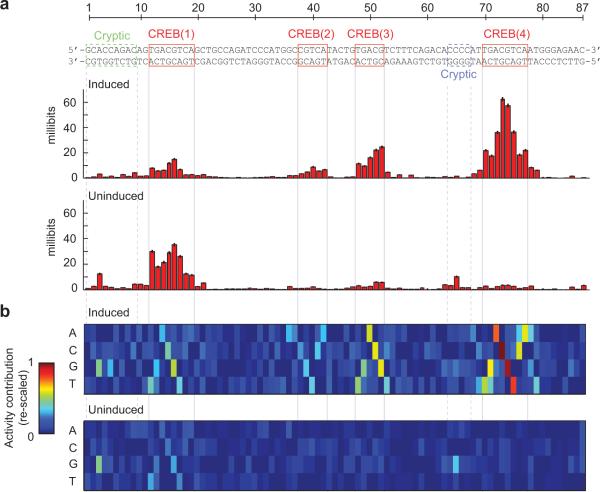
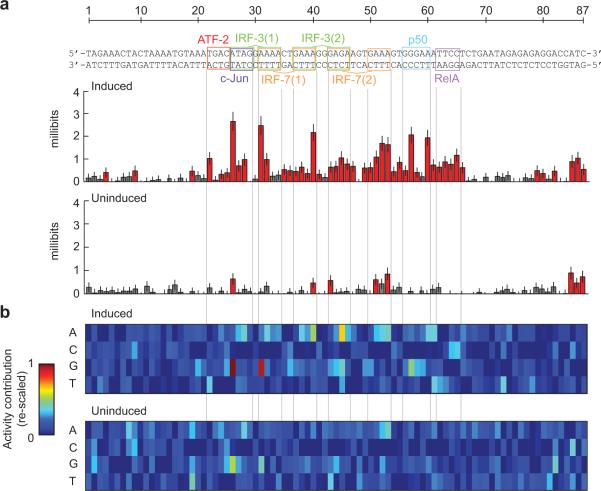
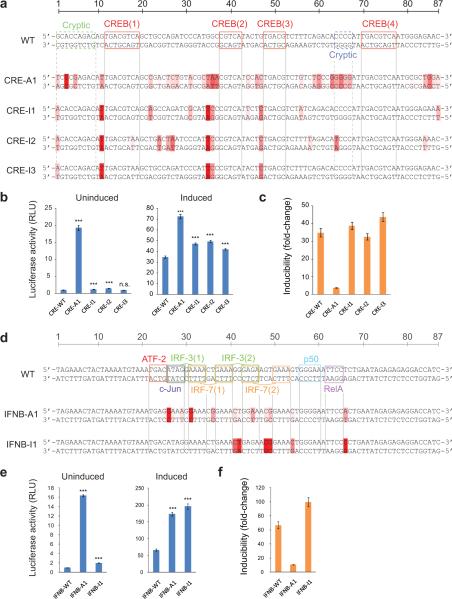
Learning to read and write the transcriptional regulatory code is of central importance to progress in genetic analysis and engineering. Here we describe a massively parallel reporter assay (MPRA) that facilitates the systematic dissection of transcriptional regulatory elements. In MPRA, microarray-synthesized DNA regulatory elements and unique sequence tags are cloned into plasmids to generate a library of reporter constructs. These constructs are transfected into cells and tag expression is assayed by high-throughput sequencing. We apply MPRA to compare >27,000 variants of two inducible enhancers in human cells: a synthetic cAMP-regulated enhancer and the virus-inducible interferon-β enhancer. We first show that the resulting data define accurate maps of functional transcription factor binding sites in both enhancers at single-nucleotide resolution. We then use the data to train quantitative sequence-activity models (QSAMs) of the two enhancers. We show that QSAMs from two cellular states can be combined to design enhancer variants that optimize potentially conflicting objectives, such as maximizing induced activity while minimizing basal activity.


Figures

Figure 1
Figure 1. Overview of MPRA
Oligonucleotides containing enhancer variants coupled to distinguishing tags are first generated using microarray-based DNA synthesis. The variants and tags are separated by two common restriction sites (circle/square). The oligonucleotides are PCR amplified from universal primer sites (not shown) and directionally cloned into a plasmid backbone. An invariant promoter-ORF segment is then inserted between the variants and tags by double digestion and directional ligation. The resulting reporter plasmid pool is cotransfected into a population of cells. The relative regulatory activities of the transfected variants are inferred by sequencing and counting their corresponding tags from the cellular mRNA and the transfected plasmid pool. See Supplementary Figure 1 for additional details.
Figure 2
Figure 2. Single-hit scanning mutagenesis of the cAMP-responsive enhancer
(a) The CRE sequence with known and putative transcription factor binding sites indicated. (b) Changes in induced activity due to single nucleotide substitutions. Each bar shows the log-ratio of the median variant and wild-type activity estimates. (c) Changes in induced activity due to 8 consecutive substitutions. The plot shows the medians of three different types of substitutions, see Supplementary Fig. 3. Each bar is located at the fourth nucleotide in the corresponding 8 nt substitution. (d) Changes in induced activity due to 5 nt (top) and 10 nt (bottom) insertions. The plots show the means of two different insertions, see Supplementary Fig. 4. Each bar is located one nucleotide to the right of the insertion. Error bars show the first and third quartile. Red indicates a significant change from wild-type (Mann-Whitney U-test, 5% FDR). Numerical values are provided in Supplementary Table 3.
Figure 3
Figure 3. Single-hit scanning mutagenesis of the virus-inducible IFNB enhancer
(a) The IFNB enhancer with known transcription factor binding sites indicated. (b) Changes in induced activity due to single nucleotide substitutions. Each bar shows the log-ratio of the median variant and wild-type activity estimates. (c) Changes in induced activity due to 8 consecutive substitutions. The plot shows the medians of three different types of substitutions, see Supplementary Fig. 5. Each bar is located at the fourth nucleotide in the corresponding 8 nt substitution. (d) Changes in induced activity due to 5 nt (top) and 10 nt (bottom) insertions. The plots show the means of two different insertions, see Supplementary Fig. 6. Each bar is located one nucleotide to the right of the insertion. Error bars show the first and third quartile. Red indicates a significant change from wild-type (Mann-Whitney U-test, 5% FDR). Numerical values are provided in Supplementary Table 4.
Figure 4
Figure 4. Multi-hit sampling mutagenesis of the cAMP-responsive enhancer
(a) Information footprints of the CRE in its induced (top) and uninduced (bottom) states. Red indicates significant information content at the corresponding position (permutation test, 5% FDR). Error bars show uncertainties inferred from sub-sampling. (b) Visual representations of linear QSAMs of the CRE in its induced (top) and uninduced (bottom) states. The color in each entry represents the estimated additive contribution of the corresponding nucleotide to the log-transformed activity of the enhancer. The matrices are re-scaled such that the lowest entry in each column is zero and the highest entry anywhere is one. Both matrices are shown on the same scale. Numerical values are provided in Supplementary Table 3.
Figure 5
Figure 5. Multi-hit sampling mutagenesis of the virus-inducible IFNB enhancer
(a) Information footprints of the IFNB enhancer in its induced (top) and uninduced (bottom) states. Red indicates significant information content at the corresponding position (permutation test, 5% FDR). Error bars show uncertainties inferred from sub-sampling. (b) Visual representations of linear QSAMs of the IFNB enhancer in its induced (top) and uninduced (bottom) states. The color in each entry represents the estimated additive contribution of the corresponding nucleotide to the log-transformed activity of the enhancer. The matrices are re-scaled such that the lowest entry in each column is zero and the highest entry anywhere is one. Both matrices are shown on the same scale. Numerical values are provided in Supplementary Table 4.
Figure 6
Figure 6. Model-based optimization
(a) CRE variants predicted to maximize induced activity (A1) or inducibility (I1ȓI3) based on linear QSAMs trained on multi-hit data. Differences from WT are indicated by red shading. Darker shading indicates a higher predicted contribution to the change in activity. (b) Luciferase activity of the wild-type (WT) and optimized CRE variants in untreated and forskolin-treated cells. (c) Inducibility of the CRE variants in response to cAMP elevation caused by forskolin treatment. (d) IFNB enhancer variants predicted to maximize induced activity (A1) or inducibility (I1) based on linear QSAMs trained on multi-hit data. (e) Luciferase activity of the WT and optimized IFNB enhancer variants in uninfected and virus-treated cells. (f) Inducibility of the IFNB enhancer variants in response to virus infection. Blue bars show mean activity across 12 replicates in the induced or uninduced states. Error bars show standard errors of the means (SE). All statistical comparisons are relative to WT in the same state; n.s., not significant; *, p ≤ 0.05; ***, p ≤ 0.0001; two-tailed t-test. Orange bars show the ratio of the corresponding induced and uninduced mean activities. Error bars show the range from (induced mean - induced SE)/(uninduced mean + uninduced SE) to (induced mean + induced SE)/(uninduced mean - uninduced SE).

Comment in

References

    1. Birney E, et al. Identification and analysis of functional elements in 1% of the human genome by the ENCODE pilot project. Nature. 2007;447:799–816. - PMC - PubMed
    1. Lander ES. Initial impact of the sequencing of the human genome. Nature. 2011;470:187–197. - PubMed
    1. Dorer DE, Nettelbeck DM. Targeting cancer by transcriptional control in cancer gene therapy and viral oncolysis. Adv Drug Deliv Rev. 2009;61:554–571. - PubMed
    1. Fan F, Wood KV. Bioluminescent assays for high-throughput screening. Assay Drug Dev Technol. 2007;5:127–136. doi:10.1089/adt.2006.053. - PubMed
    1. Loew R, Heinz N, Hampf M, Bujard H, Gossen M. Improved Tet-responsive promoters with minimized background expression. BMC Biotechnol. 2010;10:81. - PMC - PubMed

Publication types

Substances

Associated data