

Evoked and intrinsic asymmetries during auditory attention: implications for the contralateral and neglect models of functioning
- PMID: 22371310
- PMCID: PMC3563341
- DOI: 10.1093/cercor/bhs039
Evoked and intrinsic asymmetries during auditory attention: implications for the contralateral and neglect models of functioning
Abstract
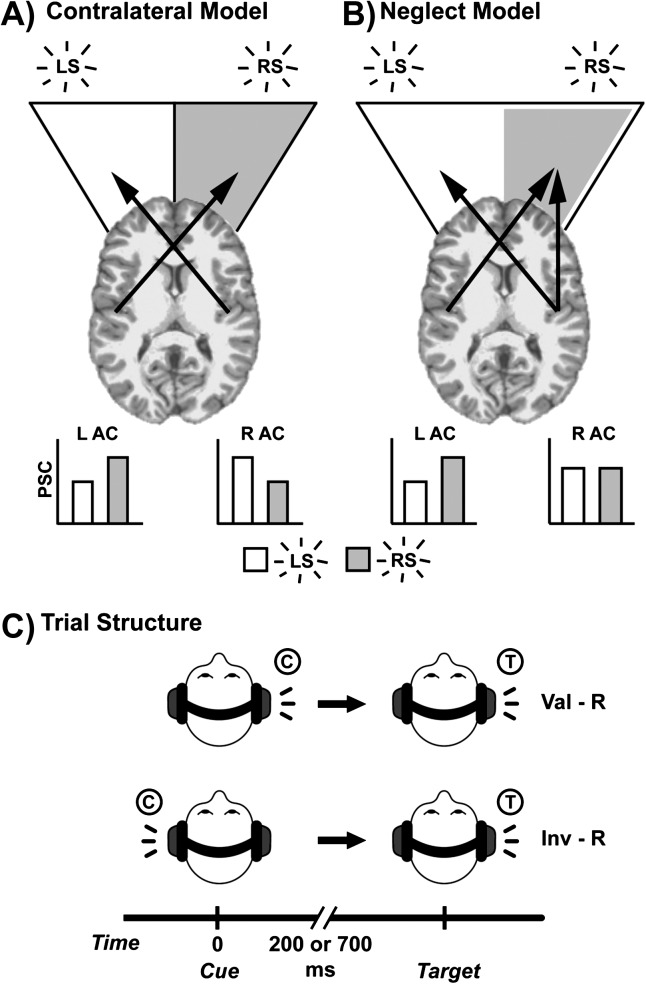
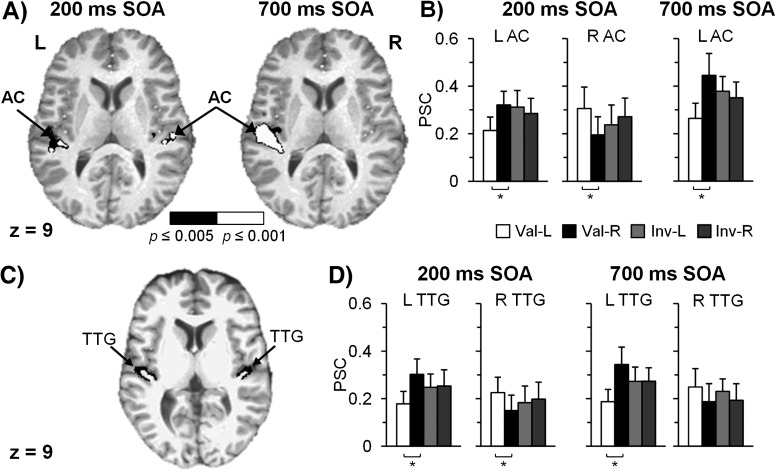
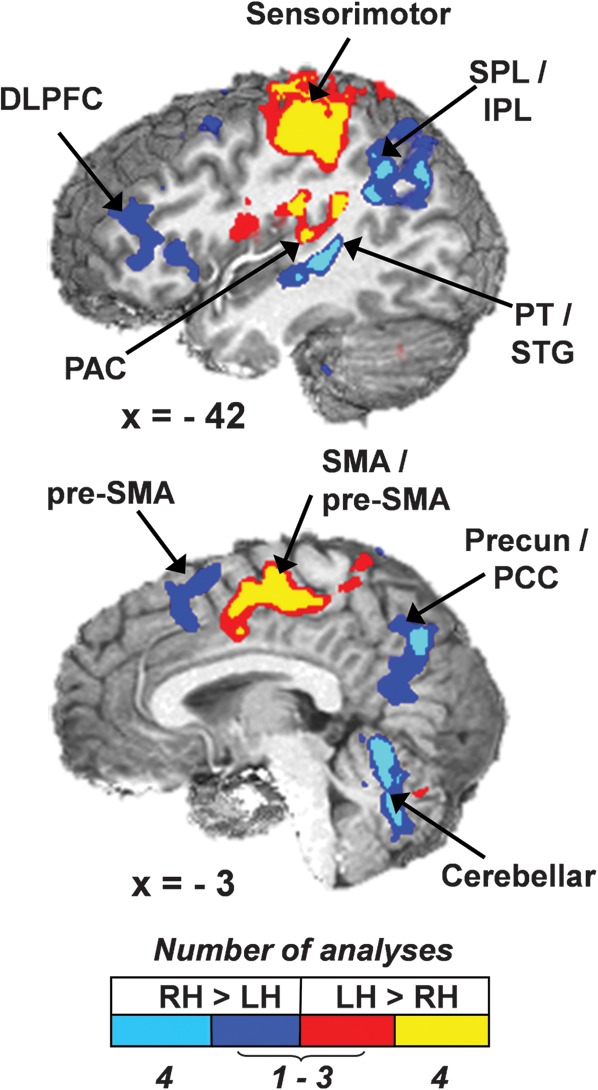
Unlike the visual system, a direct mapping of extrapersonal space does not exist within human auditory cortex (AC). Thus, models (contralateral bias vs. neglect) of how auditory spatial attention is allocated remain debated, as does the role of hemispheric asymmetries. To further examine these questions, 27 participants completed an exogenous auditory orienting task while undergoing functional magnetic resonance imaging. Resting-state data were also collected to characterize intrinsic activity within the AC. Current results provide the first evidence of hemispheric specialization in the "where" (right secondary AC) auditory processing stream during both evoked (orienting task) and intrinsic (resting-state data) activity, suggesting that spontaneous and evoked activity may be synchronized by similar cortical hierarchies. Strong evidence for a contralateral bias model was observed during rapid deployment stages (facilitation) of auditory attention in bilateral AC. However, contralateral bias increased for left and decreased for right AC (neglect model) after longer stimulus onset asynchronies (inhibition of return), suggesting a role for higher-order cortical structures in modulating AC functioning. Prime candidates for attentional modulation include the frontoparietal network, which demonstrated right hemisphere lateralization across multiple attentional states.
Figures


Similar articles
-
Effective connectivity reveals right-hemisphere dominance in audiospatial perception: implications for models of spatial neglect.J Neurosci. 2014 Apr 2;34(14):5003-11. doi: 10.1523/JNEUROSCI.3765-13.2014. J Neurosci. 2014. PMID: 24695717 Free PMC article.
-
Right hemisphere dominance for auditory attention and its modulation by eye position: an event related fMRI study.Restor Neurol Neurosci. 2007;25(3-4):211-25. Restor Neurol Neurosci. 2007. PMID: 17943000
-
Stimulus dependence of contralateral dominance in human auditory cortex.Hum Brain Mapp. 2015 Mar;36(3):883-96. doi: 10.1002/hbm.22673. Epub 2014 Oct 24. Hum Brain Mapp. 2015. PMID: 25346487 Free PMC article.
-
Stimulus-dependent activations and attention-related modulations in the auditory cortex: a meta-analysis of fMRI studies.Hear Res. 2014 Jan;307:29-41. doi: 10.1016/j.heares.2013.08.001. Epub 2013 Aug 11. Hear Res. 2014. PMID: 23938208 Review.
-
[Auditory perception and language: functional imaging of speech sensitive auditory cortex].Rev Neurol (Paris). 2001 Sep;157(8-9 Pt 1):837-46. Rev Neurol (Paris). 2001. PMID: 11677406 Review. French.
Cited by
-
An event-related FMRI study of exogenous orienting across vision and audition.Hum Brain Mapp. 2014 Mar;35(3):964-74. doi: 10.1002/hbm.22227. Epub 2013 Jan 3. Hum Brain Mapp. 2014. PMID: 23288620 Free PMC article.
-
Abnormal pre-attentive arousal in young children with autism spectrum disorder contributes to their atypical auditory behavior: an ERP study.PLoS One. 2013 Jul 25;8(7):e69100. doi: 10.1371/journal.pone.0069100. Print 2013. PLoS One. 2013. PMID: 23935931 Free PMC article.
-
From Behavioral Facilitation to Inhibition: The Neuronal Correlates of the Orienting and Reorienting of Auditory Attention.Front Hum Neurosci. 2017 Jun 6;11:293. doi: 10.3389/fnhum.2017.00293. eCollection 2017. Front Hum Neurosci. 2017. PMID: 28634448 Free PMC article.
-
Lateralized parietotemporal oscillatory phase synchronization during auditory selective attention.Neuroimage. 2014 Feb 1;86:461-9. doi: 10.1016/j.neuroimage.2013.10.043. Epub 2013 Oct 31. Neuroimage. 2014. PMID: 24185023 Free PMC article.
-
Topographic specificity of alpha power during auditory spatial attention.Neuroimage. 2020 Feb 15;207:116360. doi: 10.1016/j.neuroimage.2019.116360. Epub 2019 Nov 21. Neuroimage. 2020. PMID: 31760150 Free PMC article.
References
-
- Abdul-Kareem IA, Sluming V. Heschl gyrus and its included primary auditory cortex: structural MRI studies in healthy and diseased subjects. J Magn Reson Imaging. 2008;28:287–299. - PubMed
-
- Alho K, Medvedev SV, Pakhomov SV, Roudas MS, Tervaniemi M, Reinikainen K, Zeffiro T, Naatanen R. Selective tuning of the left and right auditory cortices during spatially directed attention. Brain Res Cogn Brain Res. 1999;7:335–341. - PubMed
-
- Altmann CF, Bledowski C, Wibral M, Kaiser J. Processing of location and pattern changes of natural sounds in the human auditory cortex. Neuroimage. 2007;35:1192–1200. - PubMed
-
- Arrington CM, Carr TH, Mayer AR, Rao SM. Neural mechanisms of visual attention: object-based selection of a region in space. J Cogn Neurosci. 2000;12:106–117. - PubMed
