. 2012 Mar;139(3):219-34.
doi: 10.1085/jgp.201110699.

Molecular and biophysical basis of glutamate and trace metal modulation of voltage-gated Ca(v)2.3 calcium channels

Affiliations

Molecular and biophysical basis of glutamate and trace metal modulation of voltage-gated Ca(v)2.3 calcium channels

Aleksandr Shcheglovitov et al. J Gen Physiol. 2012 Mar.

Erratum in

  • J Gen Physiol. 2012 May;139(5):389

Abstract

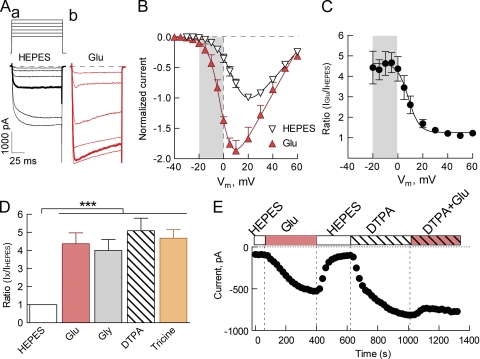
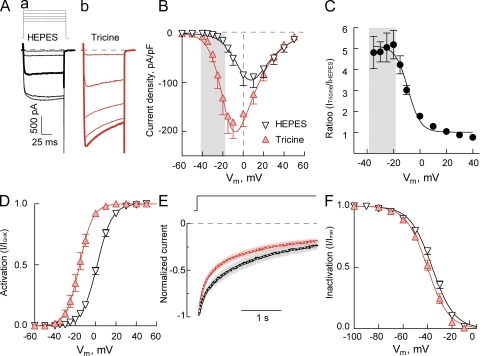
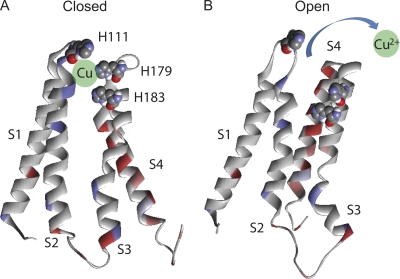
Here, we describe a new mechanism by which glutamate (Glu) and trace metals reciprocally modulate activity of the Ca(v)2.3 channel by profoundly shifting its voltage-dependent gating. We show that zinc and copper, at physiologically relevant concentrations, occupy an extracellular binding site on the surface of Ca(v)2.3 and hold the threshold for activation of these channels in a depolarized voltage range. Abolishing this binding by chelation or the substitution of key amino acid residues in IS1-IS2 (H111) and IS2-IS3 (H179 and H183) loops potentiates Ca(v)2.3 by shifting the voltage dependence of activation toward more negative membrane potentials. We demonstrate that copper regulates the voltage dependence of Ca(v)2.3 by affecting gating charge movements. Thus, in the presence of copper, gating charges transition into the "ON" position slower, delaying activation and reducing the voltage sensitivity of the channel. Overall, our results suggest a new mechanism by which Glu and trace metals transiently modulate voltage-dependent gating of Ca(v)2.3, potentially affecting synaptic transmission and plasticity in the brain.


Figures

Figure 1.
Figure 1.
Neurotransmitter amino acids potentiate current through Cav2.3 channels by acting as trace metal chelators. (A) Representative current traces recorded in response to the I-V protocol (Vhold = −90 mV; depolarizations to −15, −10, −5, 0, 10, and 20 mV) in a standard HEPES-buffered solution, containing 5 mM Ca2+ as a charge carrier, before (a) and after the addition of 200 µM Glu (b). Highlighted current traces elicited in response to 0-mV voltage step. (B) Normalized peak current I-V relationships measured in control HEPES and Glu-containing solutions. Data from each cell were fitted with GHK Eq. 1 (HEPES: V1/2 = 19.4 ± 1.9 and k = 7.4 ± 0.2 mV; Glu: V1/2 = 5.4 ± 2.0 and k = 5.9 ± 0.3 mV; **, P < 0.001 by paired Student’s t test for both parameters; n = 5). (C) Voltage dependence of the potentiating effect of Glu on Cav2.3. Ratio of peak current amplitudes (IGlu/IHEPES) at each potential plotted as a function of potential. (D) Potentiating effect of 200 µM Glu (n = 5), 200 µM Gly (n = 4), 100 µM DTPA (n = 11), and 10 mM Tricine (n = 8) on Cav2.3 currents elicited by the test pulses to −15–0 mV (***, P < 0.0001 by one-way ANOVA). (E) Time course of changes in the peak current amplitude induced by the sequential application of the indicated solutions measured at −20 mV. Note that the effect of Glu on Cav2.3 is abolished by coapplication of DTPA.
Figure 2.
Figure 2.
Tricine selectively affects the activation gating of Cav2.3. (A) Representative current traces recorded in response to the I-V protocol (Vhold = −90 mV; depolarizing pulses from −30 to +10 mV) in HEPES (a) and Tricine solutions (b) containing 1 mM Ca2+ as a charge carrier. Highlighted current traces recorded in response to a −10-mV voltage step. (B) Peak current I-V relationships obtained in HEPES- or Tricine-based extracellular solutions. Data were fitted with GHK Eq. 1 (Table 1). (C) Voltage dependence of the effect of Tricine on Cav2.3. Ratio of peak current amplitudes (ITricine/IHEPES) at each potential plotted as a function of potential. (D) Voltage dependence of activation of Cav2.3 measured in HEPES- and Tricine-based extracellular solutions. (E) Normalized and averaged Ca2+ currents ± SEM (shaded area) recorded in response to prolonged (3-s) depolarizing pulse to −10 mV in HEPES and Tricine solutions. Recordings were fitted with double-exponential function: I(t) = Af exp(−t/τf) + As exp(−t/τs) + C. Corresponding values and statistics are in Table 1. (F) Steady-state inactivation curves, measured at +30 mV after 15-s-long conditioning prepulses.
Figure 3.
Figure 3.
Tricine substitution for HEPES produces no effect on activation gating of Cav2.2 and Cav3.2 cannels. (A and D) Representative Cav2.2 (A) and Cav3.2 (B) currents recorded at +5 and −30 mV, respectively, in HEPES and Tricine solutions. (B and E) Normalized ratios of peak current amplitudes for Cav2.2 (B; n = 6) and Cav3.2 (E; n = 9) channels. (C and F) Normalized and averaged I-V relationships measured in HEPES and Tricine solutions for Cav2.2 (C; n = 6) and Cav3.2 (B) channels. Data acquired from each cell were fitted with GHK Eq. 1 (Cav2.2: HEPES V1/2 = −1.8 ± 1.0 and k = 4.5 ± 0.2 mV; Tricine V1/2 = −3.8 ± 0.9 and k = 4.6 ± 0.2 mV; n = 6; and Cav3.2: HEPES V1/2 = −47.4 ± 1.7 and k = 6.1 ± 0.2 mV; Tricine V1/2 = −48.7 ± 1.2 and k = 6.0 ± 0.3 mV; n = 4).
Figure 4.
Figure 4.
Calibration of free Zn2+ and Cu2+ concentrations in Tricine solution. (A) Fluorescence from Newport Green DCF (3 µM) was measured after the addition of varying concentrations of ZnCl2 to HEPES- and Tricine-based solutions. HEPES and Tricine solutions used for these experiments only contained 1 mM HEPES and 10 mM Tricine, respectively. KCl was added to adjust the ionic strength to 0.15 M, pH 7.4, KOH. Apparent free concentrations of Zn2+ in Tricine solution (Tricine calculated free) were calculated using the Solver function of the MaxChelator program (Patton et al., 2004). (B) Calibration of free Cu2+ concentrations in Tricine solution using 3 µM Mag-Fura-2. The addition of CuCl2 led to a dose-dependent quenching of the fluorescent signal. Solver was used to calculate the apparent free concentration of Cu2+ in Tricine solution (Tricine calculated free).
Figure 5.
Figure 5.
The effects of calibrated Zn2+ and Cu2+ concentrations on Cav2.3. (A, a) Representative current traces measured in response to a double-pulse protocol (depicted above) in Tricine- and copper-containing solutions. Copper concentrations at which currents were recorded are indicated in (b). (b and c) Time course of the effect of various Cu2+ concentrations on the amplitude of Ca2+ currents through Cav2.3, measured at −20 mV (b) and 20 mV (c). (B) Dose–response curves of the effect of Zn2+ and Cu2+ on gating of Cav2.3. Smooth lines represent the fit to the average data with the Hill equation (Zn2+: IC50 = 1.3 ± 0.2 µM and nH = 1.2; n = 6; and Cu2+: IC50 = 18.2 ± 3.7 nM and nH = 0.7; n = 8). (C) Dose–response curves of the effect of Zn2+ and Cu2+ on conductance of Cav2.3. Smooth lines represent the fit to the average data with the Hill equation (Zn2+: IC50 = 8.1 ± 1.4 µM and nH = 0.60; n = 6; and Cu2+: IC50 = 269 ± 101 nM and nH = 0.5; n = 8). (D and E) Voltage dependence of activation (D) and steady-state inactivation curves (E), measured in Tricine solution and solutions containing either 8 µM Zn2+ or 293 nM Cu2+. Data were fitted with a Boltzmann equation (Table 1).
Figure 6.
Figure 6.
Distinct effects of Cu2+ and Zn2+ on kinetics of Cav2.3 currents. (A and B) Representative current recordings obtained in response to a depolarizing pulse to +10 mV (Vhold = −90 mV) in HEPES, Tricine, and Cu2+- or Zn2+-containing extracellular solutions. (C) Normalized and averaged current recordings (n = 5).
Figure 7.
Figure 7.
Copper at low concentrations modulates the activation gating of residual (R-type) calcium current in DRG neurons. (A) Bright field and fluorescence images of IB4-positive (+) and IB4-negative (−) DRG neurons, identified by live staining with 10 µg/ml IB4-FITC (Sigma-Aldrich). Bar, 10 µm. (B) Time course of changes in the amplitude of the net Ba2+ current through VGCC, recorded from an IB4 (−) neuron in response to a 20-mV voltage step, induced by perfusion of recording chamber with the cocktail of Ca2+ channel blockers. (C) In IB4 (−) DRG neurons, ∼30% of the net current at +20 mV is carried through R-type calcium channels (n = 4). (D) Examples of recordings of isolated R-type calcium currents, measured in response to the I-V protocol (Vhold = −90 mV, depolarizations to −30, −20, −10, 0, 10, and 20 mV) in Tricine- and Cu2+-containing solutions with 5 mM Ba2+ as a charge carrier. (E) Normalized peak current I-V relationships. Data were fit with the standard Boltzmann-Ohm equation (Tricine: V1/2 = 3.1 ± 4.9 and k = 6.6 ± 1.3 mV; Cu2+: V1/2 = 7.8 ± 3.9* and k = 6.6 ± 1.3 mV; *, P = 0.026 by paired Student’s t test; n = 4). (F) The voltage dependence of the Cu2+ effect on endogenous R-type current in DRG neurons. The ratio of peak current amplitudes (ITricine/ICu) at each potential was plotted as a function of potential.
Figure 8.
Figure 8.
Histidines in the IS1–IS2 and IS3–IS4 loops underlie the trace metal sensitivity of Cav2.3. (A) Alignment of the putative amino acid residues residing in the IS1–IS2 and IS3–IS4 regions of Cav2 channels. Triple histidines, responsible for the trace metal sensitivity in Cav2.3 (highlighted), were identified by their sequential substitution: H111A/H179E/H181A. (B) Representative current traces recorded from Cav2.3 channels bearing the H179E/H181A mutation in response to the I-V protocol depicted above (Vhold = −90 mV, depolarizing pulses from −30 to 10 mV). Highlighted current traces were recorded in response to a −10-mV voltage pulse. (C) Peak current I-V relationships for H179E/H181A mutant obtained in HEPES- or Tricine-based extracellular solutions and normalized to cell capacitance. Data were fitted with GHK Eq. 1 (Table 1). (D) Normalized and averaged Ca2+ currents ± SEM (shaded area) recorded in response to prolonged (3-s) depolarizing pulse to −10 mV in HEPES and Tricine solutions. Recordings were fitted with double-exponential function. Corresponding values and statistics are in Table 1. (E) Steady-state inactivation curves for H179E/H181A mutant measured in the HEPES- or Tricine-based extracellular solutions. Data were fitted with a Boltzmann equation (Table 1). (F) Currents through H111A/H179E/H181A mutant channels, measured in response to the voltage pulse depicted above in Tricine- and Cu2+-containing solutions. (G) Dose–response curves of the Cu2+ effect on currents through Cav2.3 channels bearing various point mutations. Smooth lines represent the fit to the average data with the Hill equation (H179E: IC50 = 115 ± 11 nM and nH = 1.4; n = 4; H183A: IC50 = 142 ± 19 nM and nH = 1.4; n = 4; H179E/H183A: IC50 = 203 ± 27 nM and nH = 1.4; n = 9; and H111A: IC50 = 205 ± 75 nM and nH = 0.6; n = 5). (H) Mean values of inhibition induced by the application of 123 nM Cu2+ (***, P < 0.0001; **, P < 0.001; *, P < 0.05 by one-way ANOVA with Bonferroni posthoc correction).
Figure 9.
Figure 9.
Cu2+ at low concentrations produces “pure” effect on the activation gating of Cav2.3. (A) Tail currents recorded in Tricine- and Cu2+-containing solutions in response to the protocol depicted above. (B) Activation curves obtained from the measurements of the amplitudes of tail currents, normalized to the maximum amplitude of the tail current recorded in Tricine.
Figure 10.
Figure 10.
Cu2+ affects gating of Cav2.3 through the extracellular binding site in a state-dependent manner. (A) Time dependence of the inhibitory effect of 13 nM Cu2+ on currents through Cav2.3 channels, induced by depolarization to −20 or 20 mV (a). The percentage of inhibition at each time point was calculated as a difference in current amplitudes measured in Tricine (black traces) and Cu2+ solutions (gray traces), divided by the amplitude in Tricine (b). (B) Voltage dependence of the kinetics of facilitation of Cu2+ inhibition. Time constants were determined from A by fitting time dependences with the monoexponential functions (n = 6). (C) Voltage dependence of the inhibition of current through Cav2.3 channels by 13 nM Cu2+. The percentage of inhibition at each voltage was calculated as a difference between peak current amplitudes measured in Tricine and Cu2+ solutions divided by the current amplitude in Tricine (n = 6). (D) Strong depolarization partially reverses the inhibitory effect of Cu2+ on Cav2.3. Current traces were recorded in response to the protocol depicted above in Tricine- (a) and Cu2+-containing (b) solutions (13 nM). (E) Quantification of the Cu2+ inhibition of Cav2.3 current, recorded before ((T1−C1)/T1) or after ((T2−C2)/T2) the delivery of a depolarizing pulse to 150 mV (n = 5; ***, P < 0.0001 with paired Student’s t test).
Figure 11.
Figure 11.
A low concentration of Cu2+ (13 nM) decelerates gating charge movement in Cav2.3. (A) Representative gating current traces (the average of 20 consecutive runs ± SD) recorded in response to the step depolarization to the reversal potential (Vr = 58 ± 2 mV; n = 8) in Tricine- (a and b) and Cu2+-containing (c) solutions (13 nM). (b and c) Enlarged view of the region selected with dashed lines on (a). (B) Maximal gating charges transferred across membrane in Tricine- and Cu2+-containing solutions (n = 7). (C) Amplitudes of the gating current transients recorded in Tricine- and Cu2+-containing solutions (*, P = 0.043, by paired Student’s t test; n = 7). (D) Time constants of the gating current transient decay measured in Tricine and Cu2+ solutions (*, P = 0.014, by paired Student’s t test; n = 7).
Figure 12.
Figure 12.
Putative model of Cu2+ interaction with the gating machinery of Cav2.3. Residues responsible for Cu2+ binding in Cav2.3 (H111, H179, and H183) were mapped onto the structural model of a voltage-gated potassium channel (Chanda et al., 2005; Campos et al., 2007). Only the S1–S4 segments from the first domain are shown. (A) In closed conformation, histidines of IS1–IS2 and IS3–IS4 loops of Cav2.3 are situated close to each other and can bind Cu2+ if it is present in the solution. The green sphere illustrates a possible position for Cu2+. (B) Upon channel opening, histidines are moved apart by the gating machinery, which apparently disrupts the binding pocket and releases Cu2+ from the binding site.

Similar articles

Cited by

References

    1. Aslamkhan A.G., Aslamkhan A., Ahearn G.A. 2002. Preparation of metal ion buffers for biological experimentation: a methods approach with emphasis on iron and zinc. J. Exp. Zool. 292:507–522 10.1002/jez.10068 - DOI - PubMed
    1. Assaf S.Y., Chung S.H. 1984. Release of endogenous Zn2+ from brain tissue during activity. Nature. 308:734–736 10.1038/308734a0 - DOI - PubMed
    1. Bannister R.A., Melliti K., Adams B.A. 2004. Differential modulation of CaV2.3 Ca2+ channels by Gαq/11-coupled muscarinic receptors. Mol. Pharmacol. 65:381–388 10.1124/mol.65.2.381 - DOI - PubMed
    1. Barnham K.J., Bush A.I. 2008. Metals in Alzheimer’s and Parkinson’s diseases. Curr. Opin. Chem. Biol. 12:222–228 10.1016/j.cbpa.2008.02.019 - DOI - PubMed
    1. Birnbaumer L., Campbell K.P., Catterall W.A., Harpold M.M., Hofmann F., Horne W.A., Mori Y., Schwartz A., Snutch T.P., Tanabe T., et al. 1994. The naming of voltage-gated calcium channels. Neuron. 13:505–506 10.1016/0896-6273(94)90021-3 - DOI - PubMed

Publication types

MeSH terms