. 2012 Mar 13;109(11):4320-5.
doi: 10.1073/pnas.1119908109. Epub 2012 Feb 27.

Opposing effects of fructokinase C and A isoforms on fructose-induced metabolic syndrome in mice

Affiliations

Opposing effects of fructokinase C and A isoforms on fructose-induced metabolic syndrome in mice

Takuji Ishimoto et al. Proc Natl Acad Sci U S A. .

Abstract

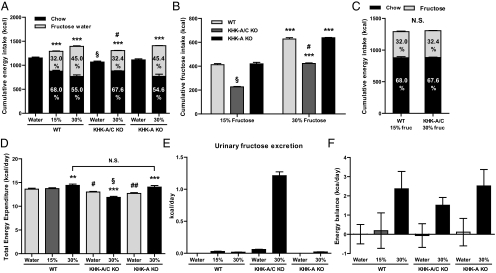
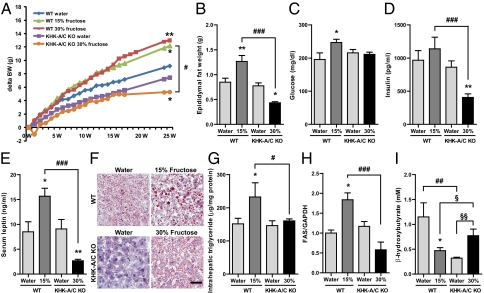
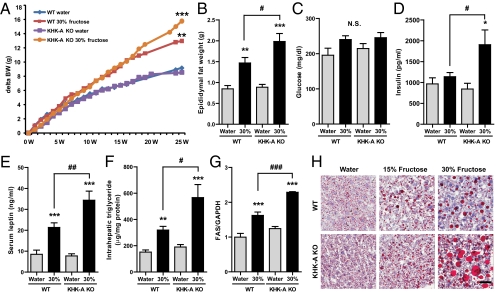
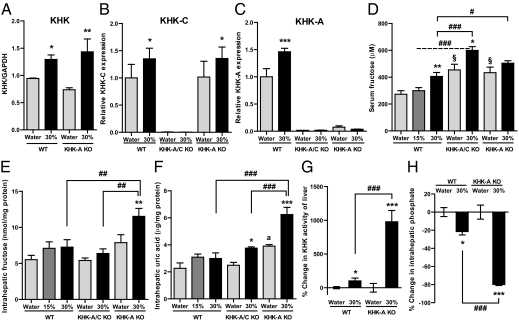
Fructose intake from added sugars correlates with the epidemic rise in obesity, metabolic syndrome, and nonalcoholic fatty liver disease. Fructose intake also causes features of metabolic syndrome in laboratory animals and humans. The first enzyme in fructose metabolism is fructokinase, which exists as two isoforms, A and C. Here we show that fructose-induced metabolic syndrome is prevented in mice lacking both isoforms but is exacerbated in mice lacking fructokinase A. Fructokinase C is expressed primarily in liver, intestine, and kidney and has high affinity for fructose, resulting in rapid metabolism and marked ATP depletion. In contrast, fructokinase A is widely distributed, has low affinity for fructose, and has less dramatic effects on ATP levels. By reducing the amount of fructose for metabolism in the liver, fructokinase A protects against fructokinase C-mediated metabolic syndrome. These studies provide insights into the mechanisms by which fructose causes obesity and metabolic syndrome.


Conflict of interest statement

Conflict of interest statement: Based on the discoveries from this study, T.I., M.A.L., and R.J.J. are listed as inventors on a patent application from the University of Colorado related to developing isoform-specific fructokinase inhibitors in the treatment of disorders associated with obesity and insulin resistance. No other authors have any conflicts of interest.

Figures

Fig. 1.
Fig. 1.
Preference for fructose and energy balance. WT mice, KHK-A/C KO mice, and KHK-A KO mice given ad libitum normal chow diet with 15 or 30% fructose water or tap water. (A) Cumulative ad libitum energy intake of normal chow diet with 30% fructose water or tap water (n = 8–9). ***P < 0.001 vs. respective water control. §P < 0.05 vs. WT water or KHK-A KO water. #P < 0.05 vs. WT or KHK-A KO mice given 30% fructose water. (B) Cumulative ad libitum fructose intake (n = 8–9). ***P < 0.001 vs. respective 15% fructose. §P < 0.001 vs. WT or KHK-A KO drinking 15% fructose water. #P < 0.05 vs. WT or KHK-A KO given 30% fructose water. (C) Cumulative ad libitum energy intake of normal chow diet with 15% fructose water in WT mice and with 30% fructose water in KHK-A/C KO mice (n = 9). (DF) Total energy expenditure (D) over the day at 19 wk. Indirect calorimetry measurements of vO2 and vCO2 were used to calculate metabolic rate (cal/min) every 16 min over 48 h. Average metabolic rate over each day was extrapolated over 24 h to acquire estimates of total energy expenditure (TEE) over the day (kcal/day) (n = 6–8 mice per group, 2 d per mouse). While in the chamber, energy intake over each 24 h was measured and 48-h urine was collected. Urinary fructose excretion (E) was measured, and then daily energy balance was calculated (F). **P < 0.01, ***P < 0.001 vs. respective water control. §P < 0.05 vs. WT or KHK-A KO mice given 30% fructose water. #P < 0.05, ##P < 0.01 vs. WT water. Data represent means ± SEM. Values in the bars mean percentages of energy intake from normal chow diet or fructose water. NS, not significant.
Fig. 2.
Fig. 2.
Effect of high fructose consumption in WT mice and KHK-A/C KO mice. WT mice and KHK-A/C KO mice given ad libitum normal chow diet with 15 or 30% fructose water or tap water for 25 wk (n = 9). Serum and tissue samples were collected after 6 h fasting. (A) Growth curves of WT mice and KHK-A/C KO mice. (BE) Epididymal fat weight (B), serum glucose (C), serum insulin (D), and serum leptin (E) (n = 9). (F) Representative images of Oil Red O staining in WT mice and KHK-A/C KO mice. (Scale bar, 50 μm.) (G) Intrahepatic triglyceride levels (n = 7). (H) Western blot analysis of fatty acid synthase (FAS). Relative intensity of FAS to GAPDH in liver (n = 4). (I) Serum β-hydroxy butyrate concentration (n = 5). Data represent means ± SEM *P < 0.05, **P < 0.01 vs. respective water control by ANOVA. #P < 0.05, ##P < 0.01, ###P < 0.001 by ANOVA. §P < 0.05, §§P < 0.01 by t test.
Fig. 3.
Fig. 3.
Effect of high fructose consumption in WT mice and KHK-A KO mice. WT mice and KHK-A KO mice given ad libitum normal chow diet with 15 or 30% fructose water or tap water for 25 wk (n = 8–9). Serum and tissue samples were collected after 6 h fasting. (A) Growth curves of WT mice and KHK-A KO mice. (BE) Epididymal fat weight (B), serum glucose (C), serum insulin (D), and serum leptin (E) (n = 9). (F) Intrahepatic triglyceride levels (n = 7). (G) Western blot analysis of FAS. Relative intensity of FAS to GAPDH in liver (n = 4). (H) Representative images of Oil Red O staining in WT mice and KHK-A KO. (Scale bar, 50 μm.) Data represent means ± SEM *P < 0.05, **P < 0.01, ***P < 0.001 vs. respective water control. #P < 0.05, ##P < 0.01, ###P < 0.001. NS, not significant.
Fig. 4.
Fig. 4.
Difference between KHK-A and KHK-C. (A and B) Kinetic analysis of recombinant human KHK-C (A) and KHK-A (B) for d-fructose. Nonlinear regression fit to Michaelis-Menten equation (n = 4). (C and D) ATP consumed by 100 ng or 1,000 ng of KHK-C (C) or KHK-A (D) with 5 mM fructose. No fructose was used as control. Data represent means. **P < 0.01, ***P < 0.001 vs. control. (EG) Quantitative RT-PCR. Relative comparison of expressions of KHK-C (E) and KHK-A (F) in various organs (n = 2–3) and in liver (G, n = 6) from WT mice.
Fig. 5.
Fig. 5.
Potential mechanisms for opposing effects of KHK-A and KHK-C on metabolic syndrome. WT mice and KHK-A KO mice given ad libitum normal chow diet with 15 or 30% fructose water or tap water for 25 wk (n = 8–9). Serum and tissue samples were collected after 6 h fasting. (A) Western blot analysis of KHK. Relative intensity of KHK to GAPDH in liver (n = 4). (B and C) Quantitative RT-PCR for KHK-C (B) and KHK-A (C) expressions in liver (n = 6). (D) Serum fructose concentration (n = 8–9). (E and F) Fructose content (E) and uric acid content (F) in liver (n = 6). (G and H) Percent change in KHK activity of liver (G, n = 5) and in intrahepatic phosphate content (H, n = 6) with fructose consumption. Data represent means ± SEM *P < 0.05, **P < 0.01, ***P < 0.001 vs. respective water control. #P < 0.05, ##P < 0.01, ###P < 0.001. §P < 0.05 vs. WT water. aP < 0.01 vs. WT water or KHK-A/C water.

Comment in

Similar articles

Cited by

References

    1. Havel PJ. Dietary fructose: Implications for dysregulation of energy homeostasis and lipid/carbohydrate metabolism. Nutr Rev. 2005;63:133–157. - PubMed
    1. Tappy L, Lê KA. Metabolic effects of fructose and the worldwide increase in obesity. Physiol Rev. 2010;90:23–46. - PubMed
    1. Johnson RJ, et al. Potential role of sugar (fructose) in the epidemic of hypertension, obesity and the metabolic syndrome, diabetes, kidney disease, and cardiovascular disease. Am J Clin Nutr. 2007;86:899–906. - PubMed
    1. Johnson RJ, et al. Hypothesis: Could excessive fructose intake and uric acid cause type 2 diabetes? Endocr Rev. 2009;30:96–116. - PMC - PubMed
    1. Stanhope KL, et al. Consuming fructose-sweetened, not glucose-sweetened, beverages increases visceral adiposity and lipids and decreases insulin sensitivity in overweight/obese humans. J Clin Invest. 2009;119:1322–1334. - PMC - PubMed

Publication types