

Comparison of statistical approaches to rare variant analysis for quantitative traits
- PMID: 22373209
- PMCID: PMC3287837
- DOI: 10.1186/1753-6561-5-S9-S113
Comparison of statistical approaches to rare variant analysis for quantitative traits
Abstract
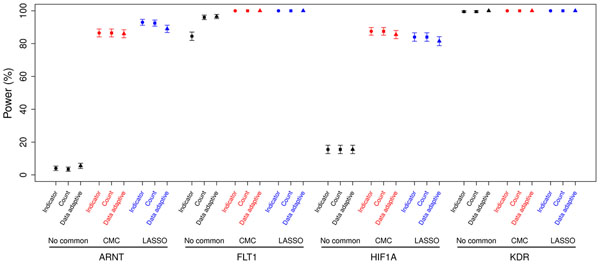
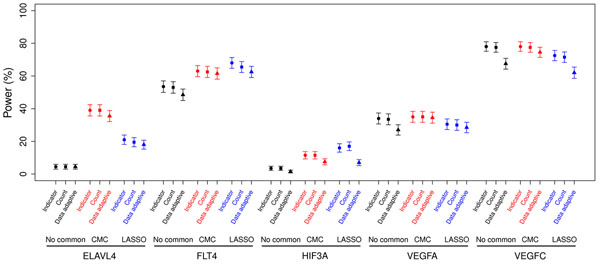
With recent advances in technology, deep sequencing data will be widely used to further the understanding of genetic influence on traits of interest. Therefore not only common variants but also rare variants need to be better used to exploit the new information provided by deep sequencing data. Recently, statistical approaches for analyzing rare variants in genetic association studies have been proposed, but many of them were designed only for dichotomous outcomes. We compare the type I error and power of several statistical approaches applicable to quantitative traits for collapsing and analyzing rare variant data within a defined gene region. In addition to comparing methods that consider only rare variants, such as indicator, count, and data-adaptive collapsing methods, we also compare methods that incorporate the analysis of common variants along with rare variants, such as CMC and LASSO regression. We find that the three methods used to collapse rare variants perform similarly in this simulation setting where all risk variants were simulated to have effects in the same direction. Further, we find that incorporating common variants is beneficial and using a LASSO regression to choose which common variants to include is most useful when there is are few common risk variants compared to the total number of risk variants.
Figures
References
-
- Tibshirani R. Regression shrinkage and selection via the LASSO. J R Stat Soc Ser B. 1996;58:267–288.
LinkOut - more resources
Full Text Sources
