. 2011;12 Suppl 13(Suppl 13):S8.
doi: 10.1186/1471-2105-12-S13-S8. Epub 2011 Nov 30.

Comprehensive evaluation of matrix factorization methods for the analysis of DNA microarray gene expression data

Affiliations

Comprehensive evaluation of matrix factorization methods for the analysis of DNA microarray gene expression data

Mi Hyeon Kim et al. BMC Bioinformatics. 2011.

Abstract

Background: Clustering-based methods on gene-expression analysis have been shown to be useful in biomedical applications such as cancer subtype discovery. Among them, Matrix factorization (MF) is advantageous for clustering gene expression patterns from DNA microarray experiments, as it efficiently reduces the dimension of gene expression data. Although several MF methods have been proposed for clustering gene expression patterns, a systematic evaluation has not been reported yet.

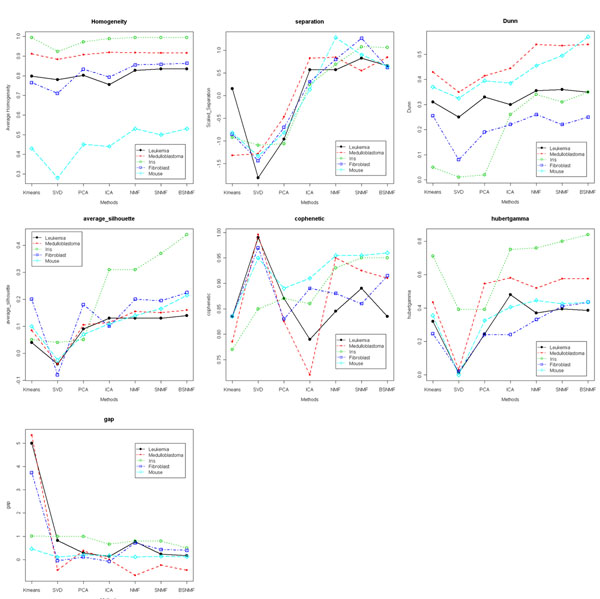
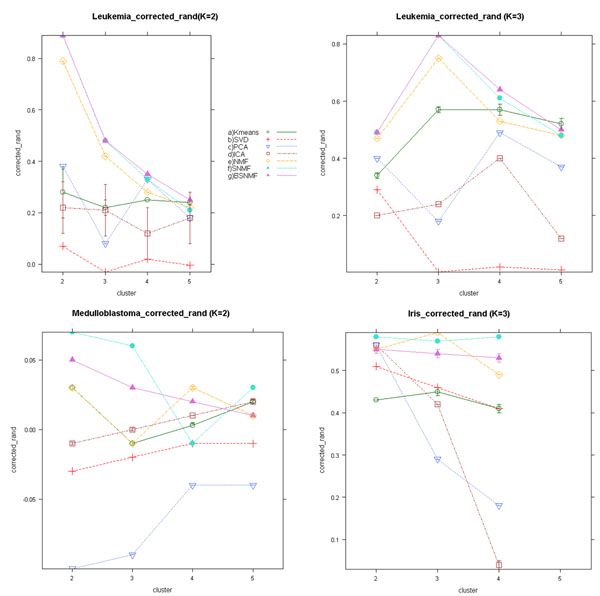
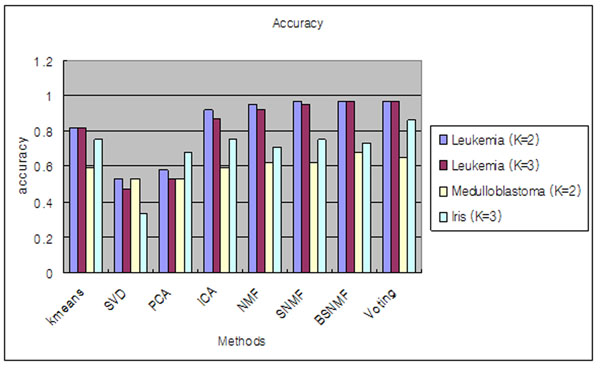
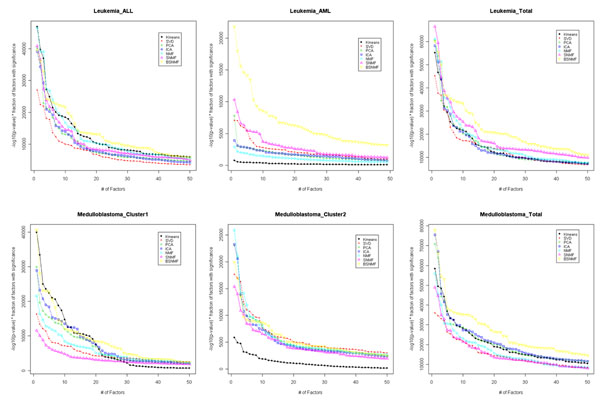
Results: Here we evaluated the clustering performance of orthogonal and non-orthogonal MFs by a total of nine measurements for performance in four gene expression datasets and one well-known dataset for clustering. Specifically, we employed a non-orthogonal MF algorithm, BSNMF (Bi-directional Sparse Non-negative Matrix Factorization), that applies bi-directional sparseness constraints superimposed on non-negative constraints, comprising a few dominantly co-expressed genes and samples together. Non-orthogonal MFs tended to show better clustering-quality and prediction-accuracy indices than orthogonal MFs as well as a traditional method, K-means. Moreover, BSNMF showed improved performance in these measurements. Non-orthogonal MFs including BSNMF showed also good performance in the functional enrichment test using Gene Ontology terms and biological pathways.

Conclusions: In conclusion, the clustering performance of orthogonal and non-orthogonal MFs was appropriately evaluated for clustering microarray data by comprehensive measurements. This study showed that non-orthogonal MFs have better performance than orthogonal MFs and K-means for clustering microarray data.


Figures

Figure 1
Figure 1
Illustration of various measures. Illustration of various measures. Here, we evaluated seven methods by six measures. Each illustration shows results from various measures such as (a) Homogeneity, (b) separation, (c) Dunn Index, (d) average silhouette width, (e) Pearson correlation of cophenetic distance, (f) Hubert gamma and (g) GAP statistic. GAP statistic is optimized when it has lower value. But other measures which have higher value are optimized.
Figure 2
Figure 2
Illustration of the Adjusted Rand index. Illustration of the Adjusted Rand index. (a) Result from leukemia dataset which has known class labels with two groups, ALL and AML, We tested various methods at rank k=2. (b) From leukemia dataset with three groups, ALL-B, ALL-T and AML. We applied the adjusted Rand index at rank k=3. (c) From medulloblastoma dataset which has known class labels with two groups, classic and desmoplastic. (d) From iris dataset that has known class labels with three groups of flower species.
Figure 3
Figure 3
Illustrations of accuracy. Illustrations of accuracy. It measures prediction power of clustering. Bar plot of accuracy from three dataset, Leukemia dataset, Medulloblastoma dataset and Iris dataset which have known labels of sample-class.
Figure 4
Figure 4
Weighted p-value of significantly enriched GO terms. Weighted p-value of significantly enriched GO terms. (a) and (b) represent result of ALL and AML cluster in leukemia dataset. (d) and (e) show result of cluster 1 (assigned to classic type) and cluster 2 (assigned to desmoplastic type) in medulloblastoma dataset. Among the entire significantly enriched factors, top 50 factors are represented. (c) and (f) represent result of top 50 factors in each entire dataset. Results from other dataset are shown in supplementary site.
Figure 5
Figure 5
Log scaled p-values for significantly enriched factors. Log scaled p-values for significantly enriched factors. Each plot represents significantly enriched terms (at α=0.05) at AML cluster in leukemia dataset using (a) K-means and (b) BSNMF. x-axis represents log10 (p-value). Entire factors were divided into five categories, GO term of biological process (BP), GO term of cellular component (CC), GO term of molecular function (MF), BIOCARTA, and pathway of KEGG.

Similar articles

Cited by

References

    1. Bicciato S, Luchini A, Di Bello C. PCA disjoint models for multiclass cancer analysis using gene expression data. Bioinformatics. 2003;19(5):571–578. doi: 10.1093/bioinformatics/btg051. - DOI - PubMed
    1. Qi Q, Zhao Y, Li M, Simon R. Non-negative matrix factorization of gene expression profiles: a plug-in for BRB-ArrayTools. Bioinformatics. 2009;25(4):545–547. doi: 10.1093/bioinformatics/btp009. - DOI - PubMed
    1. Schachtner R, Lutter D, Knollmuller P, Tome AM, Theis FJ, Schmitz G, Stetter M, Vilda PG, Lang EW. Knowledge-based gene expression classification via matrix factorization. Bioinformatics. 2008;24(15):1688–1697. doi: 10.1093/bioinformatics/btn245. - DOI - PMC - PubMed
    1. Tan Y, Shi L, Tong W, Hwang GT, Wang C. Multi-class tumor classification by discriminant partial least squares using microarray gene expression data and assessment of classification models. Comput Biol Chem. 2004;28(3):235–244. doi: 10.1016/j.compbiolchem.2004.05.002. - DOI - PubMed
    1. Ma S, Dai Y. Principal component analysis based methods in bioinformatics studies. Brief Bioinform. 2011. - PMC - PubMed

Publication types