. 2011 Nov 29;5 Suppl 9(Suppl 9):S12.
doi: 10.1186/1753-6561-5-S9-S12.

Evaluation of a LASSO regression approach on the unrelated samples of Genetic Analysis Workshop 17

Affiliations

Evaluation of a LASSO regression approach on the unrelated samples of Genetic Analysis Workshop 17

Wei Guo et al. BMC Proc. .

Abstract

The Genetic Analysis Workshop 17 data we used comprise 697 unrelated individuals genotyped at 24,487 single-nucleotide polymorphisms (SNPs) from a mini-exome scan, using real sequence data for 3,205 genes annotated by the 1000 Genomes Project and simulated phenotypes. We studied 200 sets of simulated phenotypes of trait Q2. An important feature of this data set is that most SNPs are rare, with 87% of the SNPs having a minor allele frequency less than 0.05. For rare SNP detection, in this study we performed a least absolute shrinkage and selection operator (LASSO) regression and F tests at the gene level and calculated the generalized degrees of freedom to avoid any selection bias. For comparison, we also carried out linear regression and the collapsing method, which sums the rare SNPs, modified for a quantitative trait and with two different allele frequency thresholds. The aim of this paper is to evaluate these four approaches in this mini-exome data and compare their performance in terms of power and false positive rates. In most situations the LASSO approach is more powerful than linear regression and collapsing methods. We also note the difficulty in determining the optimal threshold for the collapsing method and the significant role that linkage disequilibrium plays in detecting rare causal SNPs. If a rare causal SNP is in strong linkage disequilibrium with a common marker in the same gene, power will be much improved.


Figures
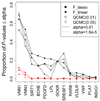
Figure 1
Figure 1
Power to detect 13 causal genes at the significance levels of 0.01 and 1.6 × 10⁻⁵ in 200 replicates. The x-axis indicates the 13 genes sorted in decreasing order of the power of the FLASSO test, and the y-axis indicates the corresponding power. The power is shown as solid black lines for the significance level 0.01 and as red dashed lines for the significance 1.6 × 10⁻⁵.
Figure 2
Figure 2
Linkage disequilibrium plot for genes SIRT1 and VLDLR. Linkage disequilibrium plots generated from Haploview. The values of R2 are shown in each cell. The color code in the Haploview plot follows the standard color scheme for Haploview: white, |D′| < 1, LOD < 2; shades of pink/red, |D′| < 1, LOD ≥ 2; blue, | D′| = 1, LOD < 2; red, |D′| = 1, LOD ≥ 2.

Similar articles

Cited by

References

    1. Li B, Leal SM. Methods for detecting associations with rare variants for common diseases: application to analysis of sequence data. Am J Hum Genet. 2008;83:311–321. doi: 10.1016/j.ajhg.2008.06.024. - DOI - PMC - PubMed
    1. Madsen BE, Browning SR. A groupwise association test for rare mutations using a weighted sum statistic. PLoS Genet. 2009;5:e1000384. doi: 10.1371/journal.pgen.1000384. - DOI - PMC - PubMed
    1. Price AL, Kryukov GV, de Bakker PI, Purcell SM, Staples J, Wei LJ, Sunyaev SR. Pooled association tests for rare variants in exon-resequencing studies. Am J Hum Genet. 2010;86:832–838. doi: 10.1016/j.ajhg.2010.04.005. - DOI - PMC - PubMed
    1. Zhu X, Feng T, Li Y, Lu Q, Elston RC. Detecting rare variants for complex traits using family and unrelated data. Genet Epidemiol. 2010;34:171–187. doi: 10.1002/gepi.20449. - DOI - PMC - PubMed
    1. Guo W, Lin S. Generalized linear modeling with regularization for detecting common disease rare haplotype association. Genet Epidemiol. 2009;33:308–316. doi: 10.1002/gepi.20382. - DOI - PMC - PubMed

LinkOut - more resources