

Large-scale risk prediction applied to Genetic Analysis Workshop 17 mini-exome sequence data
- PMID: 22373389
- PMCID: PMC3287883
- DOI: 10.1186/1753-6561-5-S9-S46
Large-scale risk prediction applied to Genetic Analysis Workshop 17 mini-exome sequence data
Abstract
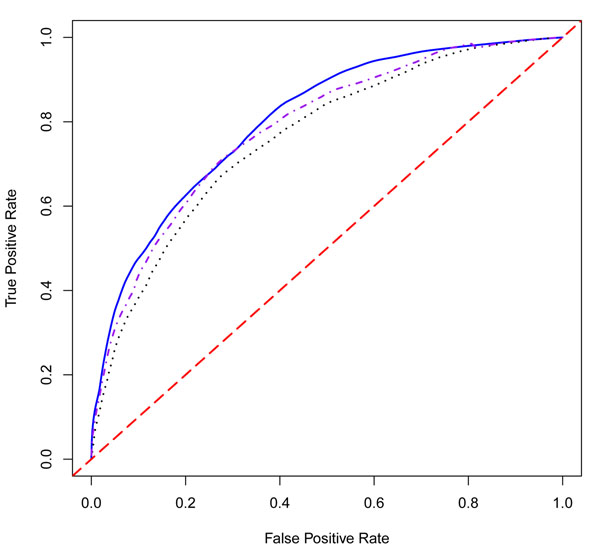
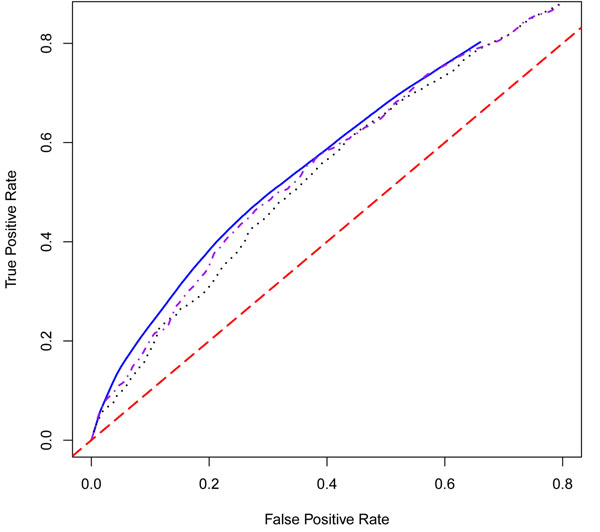
We consider the application of Efron's empirical Bayes classification method to risk prediction in a genome-wide association study using the Genetic Analysis Workshop 17 (GAW17) data. A major advantage of using this method is that the effect size distribution for the set of possible features is empirically estimated and that all subsequent parameter estimation and risk prediction is guided by this distribution. Here, we generalize Efron's method to allow for some of the peculiarities of the GAW17 data. In particular, we introduce two ways to extend Efron's model: a weighted empirical Bayes model and a joint covariance model that allows the model to properly incorporate the annotation information of single-nucleotide polymorphisms (SNPs). In the course of our analysis, we examine several aspects of the possible simulation model, including the identity of the most important genes, the differing effects of synonymous and nonsynonymous SNPs, and the relative roles of covariates and genes in conferring disease risk. Finally, we compare the three methods to each other and to other classifiers (random forest and neural network).
Figures
References
-
- Tibshirani R. Regression shrinkage and selection via the Lasso. J R Stat Soc B. 1996;58:267–288.
-
- Robert C. The Bayesian Choice. 2nd. New York, Springer Texts in Statistics; 2001.
LinkOut - more resources
Full Text Sources
