

Challenges and directions: an analysis of Genetic Analysis Workshop 17 data by collapsing rare variants within family data
- PMID: 22373451
- PMCID: PMC3287866
- DOI: 10.1186/1753-6561-5-S9-S30
Challenges and directions: an analysis of Genetic Analysis Workshop 17 data by collapsing rare variants within family data
Abstract
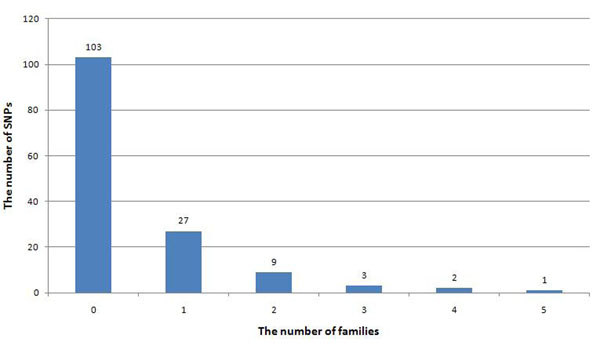
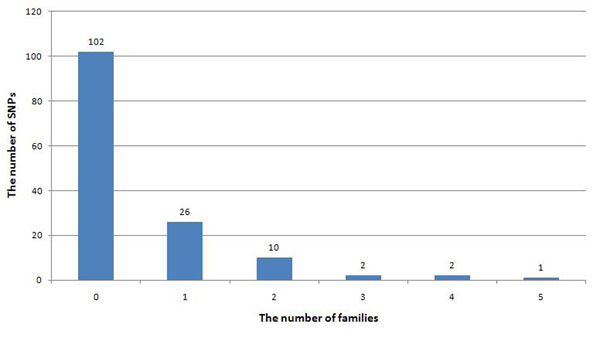
Recent studies suggest that the traditional case-control study design does not have sufficient power to discover rare risk variants. Two different methods-collapsing and family data-are suggested as alternatives for discovering these rare variants. Compared with common variants, rare variants have unique characteristics. In this paper, we assess the distribution of rare variants in family data. We notice that a large number of rare variants exist only in one or two families and that the association result is largely shaped by those families. Therefore we explore the possibility of integrating both the collapsing method and the family data method. This combinational approach offers a potential power boost for certain causal genes, including VEGFA, VEGFC, SIRT1, SREBF1, PIK3R3, VLDLR, PLAT, and FLT4, and thus deserves further investigation.
Figures
Similar articles
-
Identifying causal rare variants of disease through family-based analysis of Genetics Analysis Workshop 17 data set.BMC Proc. 2011 Nov 29;5 Suppl 9(Suppl 9):S21. doi: 10.1186/1753-6561-5-S9-S21. BMC Proc. 2011. PMID: 22373204 Free PMC article.
-
Improved power by collapsing rare and common variants based on a data-adaptive forward selection strategy.BMC Proc. 2011 Nov 29;5 Suppl 9(Suppl 9):S114. doi: 10.1186/1753-6561-5-S9-S114. BMC Proc. 2011. PMID: 22373230 Free PMC article.
-
Whole genome sequence analysis of the simulated systolic blood pressure in Genetic Analysis Workshop 18 family data: long-term average and collapsing methods.BMC Proc. 2014 Jun 17;8(Suppl 1 Genetic Analysis Workshop 18Vanessa Olmo):S12. doi: 10.1186/1753-6561-8-S1-S12. eCollection 2014. BMC Proc. 2014. PMID: 25519365 Free PMC article.
-
Weighted selective collapsing strategy for detecting rare and common variants in genetic association study.BMC Genet. 2012 Feb 6;13:7. doi: 10.1186/1471-2156-13-7. BMC Genet. 2012. PMID: 22309429 Free PMC article.
-
Detecting functional rare variants by collapsing and incorporating functional annotation in Genetic Analysis Workshop 17 mini-exome data.BMC Proc. 2011 Nov 29;5 Suppl 9(Suppl 9):S27. doi: 10.1186/1753-6561-5-S9-S27. BMC Proc. 2011. PMID: 22373324 Free PMC article.
Cited by
-
Population-based and family-based designs to analyze rare variants in complex diseases.Genet Epidemiol. 2011;35 Suppl 1(Suppl 1):S41-7. doi: 10.1002/gepi.20648. Genet Epidemiol. 2011. PMID: 22128057 Free PMC article.
-
The fibromyalgia family study: a genome-wide linkage scan study.Arthritis Rheum. 2013 Apr;65(4):1122-8. doi: 10.1002/art.37842. Arthritis Rheum. 2013. PMID: 23280346 Free PMC article.
References
Grants and funding
LinkOut - more resources
Full Text Sources
Miscellaneous
