

Brain energy metabolism and blood flow differences in healthy aging
- PMID: 22373642
- PMCID: PMC3390816
- DOI: 10.1038/jcbfm.2012.18
Brain energy metabolism and blood flow differences in healthy aging
Abstract
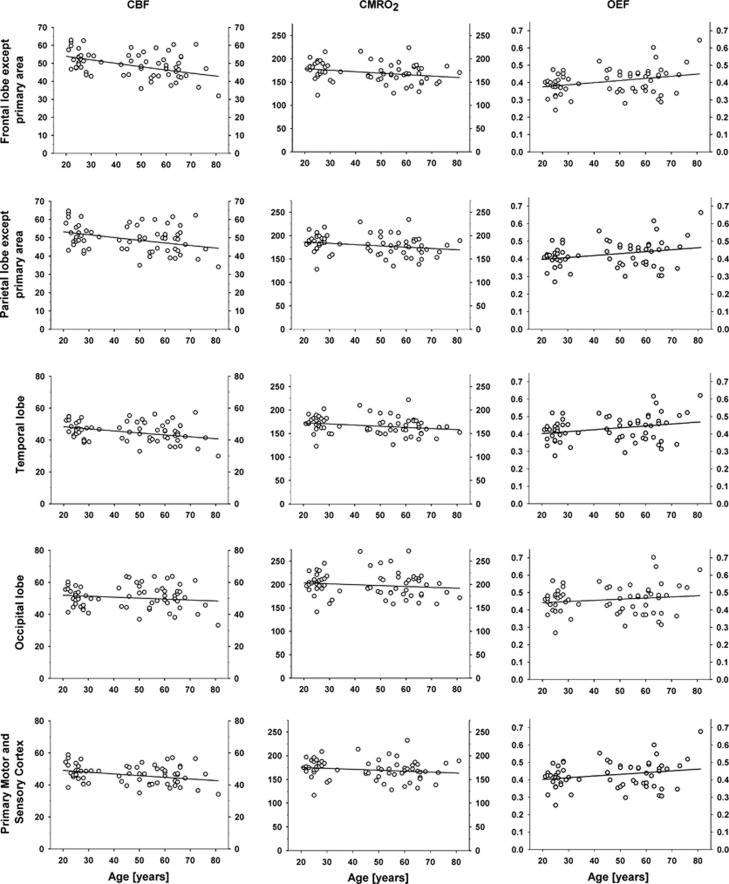
Cerebral metabolic rate of oxygen consumption (CMRO(2)), cerebral blood flow (CBF), and oxygen extraction fraction (OEF) are important indices of healthy aging of the brain. Although a frequent topic of study, changes of CBF and CMRO(2) during normal aging are still controversial, as some authors find decreases of both CBF and CMRO(2) but increased OEF, while others find no change, and yet other find divergent changes. In this reanalysis of previously published results from positron emission tomography of healthy volunteers, we determined CMRO(2) and CBF in 66 healthy volunteers aged 21 to 81 years. The magnitudes of CMRO(2) and CBF declined in large parts of the cerebral cortex, including association areas, but the primary motor and sensory areas were relatively spared. We found significant increases of OEF in frontal and parietal cortices, excluding primary motor and somatosensory regions, and in the temporal cortex. Because of the inverse relation between OEF and capillary oxygen tension, increased OEF can compromise oxygen delivery to neurons, with possible perturbation of energy turnover. The results establish a possible mechanism of progression from healthy to unhealthy brain aging, as the regions most affected by age are the areas that are most vulnerable to neurodegeneration.
Figures
References
-
- Ashkanian M, Gjedde A, Mouridsen K, Vafaee M, Hansen KV, Ostergaard L, Andersen G. Carbogen inhalation increases oxygen transport to hypoperfused brain tissue in patients with occlusive carotid artery disease: increased oxygen transport to hypoperfused brain. Brain Res. 2009;1304:90–95. - PubMed
-
- Blomqvist G. On the construction of functional maps in positron emission tomography. J Cereb Blood Flow Metab. 1984;4:629–632. - PubMed
-
- Borghammer P, Aanerud J, Gjedde A. Data-driven intensity normalization of PET group comparison studies is superior to global mean normalization. Neuroimage. 2009a;46:981–988. - PubMed
-
- Borghammer P, Cumming P, Aanerud J, Gjedde A. Artefactual subcortical hyperperfusion in PET studies normalized to global mean: lessons from Parkinson's disease. Neuroimage. 2009b;45:249–257. - PubMed
-
- Borghammer P, Jonsdottir KY, Cumming P, Ostergaard K, Vang K, Ashkanian M, Vafaee M, Iversen P, Gjedde A. Normalization in PET group comparison studies--the importance of a valid reference region. Neuroimage. 2008;40:529–540. - PubMed
Publication types
MeSH terms
LinkOut - more resources
Full Text Sources
Medical
